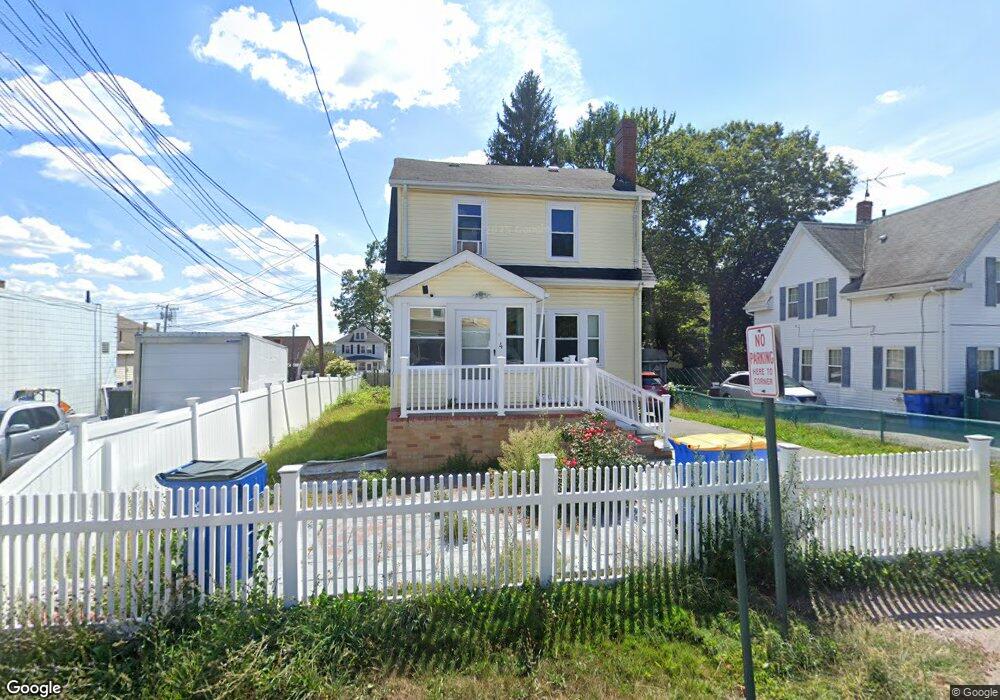
4 Royal St Randolph, MA 02368
North Randolph NeighborhoodEstimated Value: $478,000 - $569,000
3
Beds
2
Baths
1,199
Sq Ft
$441/Sq Ft
Est. Value
About This Home
This home is located at 4 Royal St, Randolph, MA 02368 and is currently estimated at $529,346, approximately $441 per square foot. 4 Royal St is a home located in Norfolk County with nearby schools including Randolph High School and Lighthouse Baptist Christian Academy.
Ownership History
Date
Name
Owned For
Owner Type
Purchase Details
Closed on
Sep 28, 2001
Sold by
Norris Tr Mary
Bought by
Edward Guersie
Current Estimated Value
Home Financials for this Owner
Home Financials are based on the most recent Mortgage that was taken out on this home.
Original Mortgage
$216,100
Outstanding Balance
$84,713
Interest Rate
6.91%
Mortgage Type
Purchase Money Mortgage
Estimated Equity
$444,633
Create a Home Valuation Report for This Property
The Home Valuation Report is an in-depth analysis detailing your home's value as well as a comparison with similar homes in the area
Home Values in the Area
Average Home Value in this Area
Purchase History
| Date | Buyer | Sale Price | Title Company |
|---|---|---|---|
| Edward Guersie | $227,500 | -- |
Source: Public Records
Mortgage History
| Date | Status | Borrower | Loan Amount |
|---|---|---|---|
| Open | Edward Guersie | $216,100 |
Source: Public Records
Tax History
| Year | Tax Paid | Tax Assessment Tax Assessment Total Assessment is a certain percentage of the fair market value that is determined by local assessors to be the total taxable value of land and additions on the property. | Land | Improvement |
|---|---|---|---|---|
| 2025 | $4,910 | $422,900 | $208,700 | $214,200 |
| 2024 | $4,816 | $420,600 | $204,600 | $216,000 |
| 2023 | $4,491 | $371,800 | $186,000 | $185,800 |
| 2022 | $4,372 | $321,500 | $155,000 | $166,500 |
| 2021 | $4,110 | $278,100 | $129,200 | $148,900 |
| 2020 | $4,024 | $269,900 | $129,200 | $140,700 |
| 2019 | $3,854 | $257,300 | $123,000 | $134,300 |
| 2018 | $3,587 | $225,900 | $111,800 | $114,100 |
| 2017 | $3,681 | $227,500 | $104,300 | $123,200 |
| 2016 | $3,560 | $204,700 | $94,800 | $109,900 |
| 2015 | $3,417 | $188,800 | $90,300 | $98,500 |
Source: Public Records
Map
Nearby Homes
- 23 Old St
- 9 Royal Crest Dr Unit 12
- 72 Canton St
- 4 Franklin Square Unit 4F
- 51 Himoor Cir
- 875 N Main St
- 10 Michael Rd
- 195 High St
- 232 Canton St Unit 308
- 232 Canton St Unit 104
- 902 Irving Rd Unit 902
- 34 Orchard St
- 1 William Morrison Dr
- 20 Simmonds Blvd Unit 20
- 18 Simmonds Blvd Unit 18
- 8 Simmonds Blvd Unit 8
- 22 Simmonds Blvd Unit 22
- 10 Simmonds Blvd Unit 10
- 24 Simmonds Blvd Unit 24
- 6 Simmonds Blvd Unit 6
- 6 Royal St
- 1112 N Main St
- 1108 N Main St Unit 2
- 1108 N Main St
- 1108 N Main St Unit 1-2
- 8 Royal St
- 5 Emeline St
- 9 Emeline St
- 1104 N Main St
- 3 Royal St
- 3 Royal St Unit 12
- 3 Royal St Unit 1
- 10 Royal St
- 11 Emeline St
- 7 Royal St
- 7 Royal St Unit 7
- 7 Royal St Unit B
- 7 Royal St Unit 1
- 1120 N Main St
- 12 Royal St
Your Personal Tour Guide
Ask me questions while you tour the home.