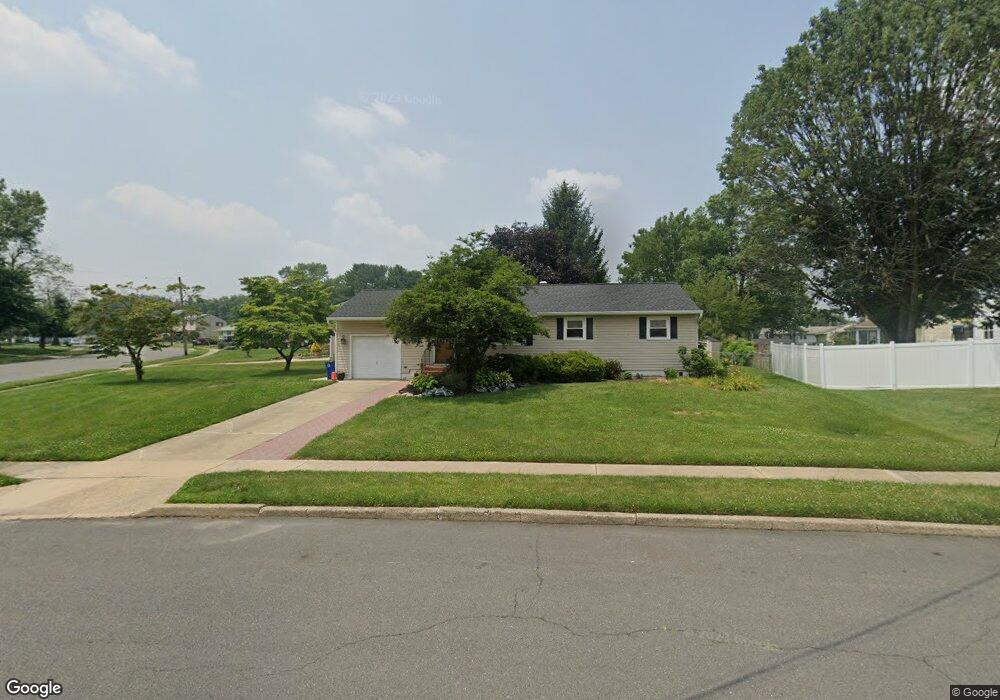
4 Running Brook Rd Ewing, NJ 08638
Braeburn Heights NeighborhoodEstimated Value: $325,000 - $473,000
3
Beds
2
Baths
1,144
Sq Ft
$341/Sq Ft
Est. Value
About This Home
This home is located at 4 Running Brook Rd, Ewing, NJ 08638 and is currently estimated at $389,768, approximately $340 per square foot. 4 Running Brook Rd is a home located in Mercer County with nearby schools including Ewing High School and Trenton Stem-To-Civics Charter School.
Ownership History
Date
Name
Owned For
Owner Type
Purchase Details
Closed on
Oct 13, 2020
Sold by
Ridorfino Jamie L and Ridorfino Christopher M
Bought by
Manges Ralph and Manges Debra
Current Estimated Value
Purchase Details
Closed on
Apr 24, 2008
Sold by
Gale Presson R and Gale Joan D
Bought by
Ridorfino Jamie L and Ridorfino Christopher M
Home Financials for this Owner
Home Financials are based on the most recent Mortgage that was taken out on this home.
Original Mortgage
$213,750
Interest Rate
6.22%
Mortgage Type
New Conventional
Purchase Details
Closed on
Oct 12, 1999
Sold by
Kiovsky Cathrine
Bought by
Presson Gale and Gale Joan
Purchase Details
Closed on
Sep 29, 1993
Sold by
Gould James
Bought by
Klovsky Catherine and Klovsky Kim
Home Financials for this Owner
Home Financials are based on the most recent Mortgage that was taken out on this home.
Original Mortgage
$100,000
Interest Rate
6.9%
Create a Home Valuation Report for This Property
The Home Valuation Report is an in-depth analysis detailing your home's value as well as a comparison with similar homes in the area
Home Values in the Area
Average Home Value in this Area
Purchase History
| Date | Buyer | Sale Price | Title Company |
|---|---|---|---|
| Manges Ralph | $154,000 | Surety Title | |
| Manges Ralph | $154,000 | Surety Title | |
| Ridorfino Jamie L | $225,000 | -- | |
| Presson Gale | $134,500 | -- | |
| Klovsky Catherine | $126,000 | -- |
Source: Public Records
Mortgage History
| Date | Status | Borrower | Loan Amount |
|---|---|---|---|
| Previous Owner | Ridorfino Jamie L | $213,750 | |
| Previous Owner | Klovsky Catherine | $100,000 |
Source: Public Records
Tax History
| Year | Tax Paid | Tax Assessment Tax Assessment Total Assessment is a certain percentage of the fair market value that is determined by local assessors to be the total taxable value of land and additions on the property. | Land | Improvement |
|---|---|---|---|---|
| 2025 | $7,717 | $196,200 | $64,900 | $131,300 |
| 2024 | $7,254 | $196,200 | $64,900 | $131,300 |
| 2023 | $7,254 | $196,200 | $64,900 | $131,300 |
| 2022 | $7,057 | $196,200 | $64,900 | $131,300 |
| 2021 | $6,885 | $196,200 | $64,900 | $131,300 |
| 2020 | $6,787 | $196,200 | $64,900 | $131,300 |
| 2019 | $6,610 | $196,200 | $64,900 | $131,300 |
| 2018 | $6,523 | $123,500 | $56,500 | $67,000 |
| 2017 | $6,675 | $123,500 | $56,500 | $67,000 |
| 2016 | $6,585 | $123,500 | $56,500 | $67,000 |
| 2015 | $6,497 | $123,500 | $56,500 | $67,000 |
| 2014 | $6,480 | $123,500 | $56,500 | $67,000 |
Source: Public Records
Map
Nearby Homes
- 347 Green Ln
- 256 Ewingville Rd
- 42 Running Brook Rd
- 23 Sundew Dr
- 4 Blossom Dr
- 138 Tulip Ln
- 4 David Dr
- 513 Eggerts Crossing Rd
- 71 Bakun Way
- 40 Arden Ave
- 370 Eggerts Crossing Rd
- 200 Upland Ave
- 438 Ewingville Rd
- 16 Bittersweet Rd
- 140 Crescent Ave
- 177 Drift Ave
- 41 Poland St
- 7 Mabel St
- 33 Sherbrooke Rd
- Lot 8 Alcazar Ave
- 4 Spring Valley Ln
- 293 Ewingville Rd
- 297 Ewingville Rd
- 1 Running Brook Rd
- 6 Spring Valley Ln
- 6 Running Brook Rd
- 289 Ewingville Rd
- 301 Ewingville Rd
- 3 Spring Valley Ln
- 3 Running Brook Rd
- 8 Spring Valley Ln
- 300 Ewingville Rd
- 10 Spring Valley Ln
- 8 Running Brook Rd
- 21 Bent Twig Ln
- 305 Ewingville Rd
- 285 Ewingville Rd
- 101 Running Brook Rd
- 5 Running Brook Rd
- 304 Ewingville Rd
Your Personal Tour Guide
Ask me questions while you tour the home.