
Seller's Agent in 2025
Christina Reardon
Keller Williams Realty Coastal
(843) 726-2841
1 in this area
61 Total Sales
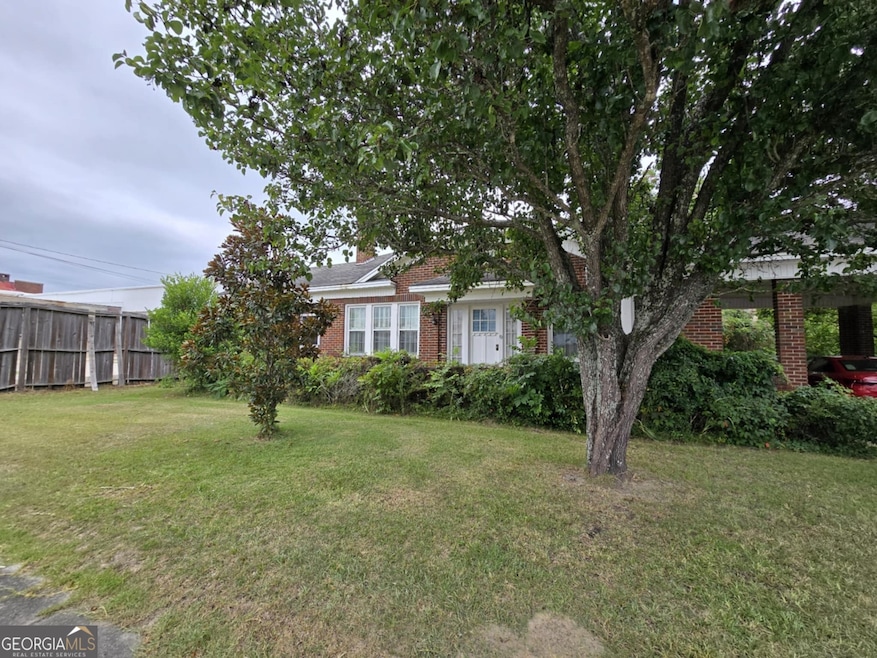
This 4-bedroom, 3-bath brick home offers space, potential, and great features for the right buyer. With a little TLC, you can bring this gem back to life! Enjoy an inground pool (deck needs repair), a spacious walk-in attic for extra storage or expansion potential, and a detached workshop-perfect for hobbies, projects, or additional storage. A fantastic opportunity to create your dream home.
Last Agent to Sell the Property
Keller Williams Realty Coastal License #376984 Listed on: 08/07/2025
Last Buyer's Agent
No Sales Agent
Non-Mls Company License #0
| Date | Type | Sale Price | Title Company |
|---|---|---|---|
| Limited Warranty Deed | $160,000 | -- | |
| Quit Claim Deed | -- | -- | |
| Deed | $129,000 | -- | |
| Deed | $100,000 | -- | |
| Warranty Deed | $99,950 | -- | |
| Deed | $76,000 | -- | |
| Deed | -- | -- | |
| Deed | $36,000 | -- |
| Date | Status | Loan Amount | Loan Type |
|---|---|---|---|
| Previous Owner | $112,350 | New Conventional | |
| Previous Owner | $133,257 | No Value Available |
| Date | Event | Price | List to Sale | Price per Sq Ft |
|---|---|---|---|---|
| 09/30/2025 09/30/25 | Sold | $160,000 | -4.8% | $61 / Sq Ft |
| 08/10/2025 08/10/25 | Pending | -- | -- | -- |
| 08/07/2025 08/07/25 | For Sale | $168,000 | -- | $64 / Sq Ft |
| Year | Tax Paid | Tax Assessment Tax Assessment Total Assessment is a certain percentage of the fair market value that is determined by local assessors to be the total taxable value of land and additions on the property. | Land | Improvement |
|---|---|---|---|---|
| 2024 | $1,571 | $68,160 | $4,920 | $63,240 |
| 2023 | $1,698 | $42,200 | $3,360 | $38,840 |
| 2022 | $1,529 | $42,200 | $3,360 | $38,840 |
| 2021 | $1,251 | $42,200 | $3,360 | $38,840 |
| 2020 | $1,257 | $42,280 | $3,360 | $38,920 |
| 2019 | $1,218 | $42,280 | $3,360 | $38,920 |
| 2018 | $1,200 | $41,560 | $3,360 | $38,200 |
| 2017 | $1,191 | $42,560 | $3,360 | $39,200 |
| 2016 | $1,272 | $45,000 | $3,360 | $41,640 |
| 2015 | -- | $43,160 | $3,360 | $39,800 |
| 2014 | -- | $43,160 | $3,360 | $39,800 |
| 2013 | -- | $43,880 | $3,360 | $40,520 |
Seller's Agent in 2025
Christina Reardon
Keller Williams Realty Coastal
(843) 726-2841
1 in this area
61 Total Sales
N
Buyer's Agent in 2025
No Sales Agent
Non-Mls Company
Source: Georgia MLS
MLS Number: 10580730
APN: C12-028
Disclaimer: Certain information contained herein is derived from information provided by parties other than Homes.com. All information provided is deemed reliable, but is not guaranteed to be accurate and should be independently verified.
![]() The data relating to real estate for sale on this web site comes in part from the Broker Reciprocity Program of Georgia MLS. Real estate listings held by brokerage firms other than Redfin are marked with the Broker Reciprocity logo and detailed information about them includes the name of the listing brokers. Information deemed reliable but not guaranteed. Copyright 2025 Georgia MLS. All rights reserved.
The data relating to real estate for sale on this web site comes in part from the Broker Reciprocity Program of Georgia MLS. Real estate listings held by brokerage firms other than Redfin are marked with the Broker Reciprocity logo and detailed information about them includes the name of the listing brokers. Information deemed reliable but not guaranteed. Copyright 2025 Georgia MLS. All rights reserved.