Estimated Value: $89,647 - $159,000
--
Bed
--
Bath
932
Sq Ft
$136/Sq Ft
Est. Value
About This Home
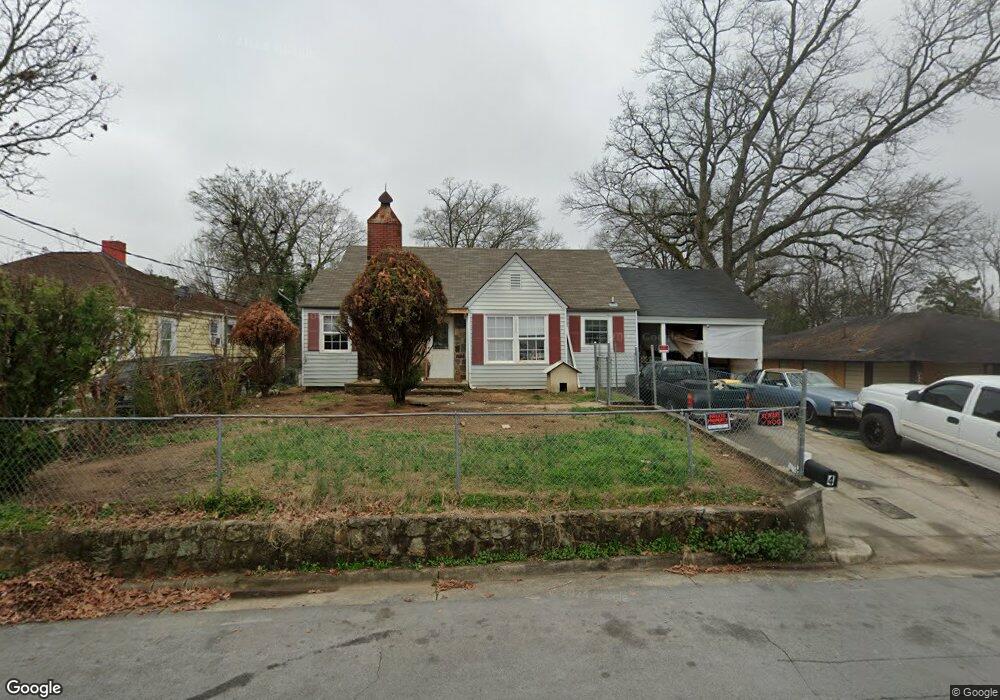
This home is located at 4 S Sycamore St SW, Rome, GA 30165 and is currently estimated at $126,412, approximately $135 per square foot. 4 S Sycamore St SW is a home located in Floyd County with nearby schools including Rome High School and St. Mary School.
Ownership History
Date
Name
Owned For
Owner Type
Purchase Details
Closed on
Feb 14, 2019
Sold by
Alvarez Stephany Lopez
Bought by
Lopez Rafael
Current Estimated Value
Purchase Details
Closed on
Nov 20, 2017
Sold by
Lopez Raphael
Bought by
Lopez-Alvarez Stephany
Purchase Details
Closed on
Nov 10, 1999
Sold by
Dempsey Lynn and Gaines Dempsey
Bought by
Lopez Raphael
Purchase Details
Closed on
Dec 4, 1998
Sold by
Chesnut Charles F and Chesnut Becky A
Bought by
Dempsey Lynn and Gaines Dempsey
Purchase Details
Closed on
Jun 28, 1990
Sold by
Collins James W and Collins Patricia T
Bought by
Chesnut Charles F and Chesnut Becky A
Purchase Details
Closed on
Apr 7, 1988
Sold by
Crumley Bobby Jeffrey
Bought by
Collins James W and Collins Patricia T
Purchase Details
Closed on
Feb 1, 1985
Sold by
Williams Marshall H Mrs
Bought by
Crumley Bobby Jeffrey
Purchase Details
Closed on
Dec 12, 1969
Sold by
Williams Austin Douglas
Bought by
Williams Marshall H Mrs
Purchase Details
Closed on
Aug 7, 1959
Bought by
Williams Austin Douglas
Create a Home Valuation Report for This Property
The Home Valuation Report is an in-depth analysis detailing your home's value as well as a comparison with similar homes in the area
Home Values in the Area
Average Home Value in this Area
Purchase History
| Date | Buyer | Sale Price | Title Company |
|---|---|---|---|
| Lopez Rafael | -- | -- | |
| Lopez-Alvarez Stephany | -- | -- | |
| Lopez Raphael | $55,900 | -- | |
| Dempsey Lynn | $43,000 | -- | |
| Chesnut Charles F | $26,000 | -- | |
| Collins James W | $23,700 | -- | |
| Crumley Bobby Jeffrey | $26,500 | -- | |
| Williams Marshall H Mrs | -- | -- | |
| Williams Austin Douglas | -- | -- |
Source: Public Records
Tax History Compared to Growth
Tax History
| Year | Tax Paid | Tax Assessment Tax Assessment Total Assessment is a certain percentage of the fair market value that is determined by local assessors to be the total taxable value of land and additions on the property. | Land | Improvement |
|---|---|---|---|---|
| 2024 | $1,164 | $29,930 | $4,536 | $25,394 |
| 2023 | $1,060 | $28,364 | $4,032 | $24,332 |
| 2022 | $853 | $23,373 | $3,360 | $20,013 |
| 2021 | $788 | $21,225 | $3,360 | $17,865 |
| 2020 | $723 | $19,323 | $2,520 | $16,803 |
| 2019 | $675 | $18,238 | $2,520 | $15,718 |
| 2018 | $635 | $17,152 | $2,520 | $14,632 |
| 2017 | $611 | $16,515 | $2,520 | $13,995 |
| 2016 | $640 | $17,240 | $2,520 | $14,720 |
| 2015 | $616 | $17,240 | $2,520 | $14,720 |
| 2014 | $616 | $17,560 | $2,520 | $15,040 |
Source: Public Records
Map
Nearby Homes
- 8 Leon St SW
- 8 S Hughes St SW
- 204 Cherry St SW
- 21 Sweetspire Dr NW
- 23 Sweetspire Dr NW
- 15 Silverbell Ln
- 214 N Elm St NW
- 50 Melton Ave SW
- 100 Dellwood Dr NW
- 40 Paris Dr SW
- 0 Mount Alto Rd SW Unit 10523740
- 13 Ridgewood Rd SW
- 311 Wilkerson Rd SW
- 14 Berckman Ln SW
- 207 Paris Dr SW
- 3 Berckman Ln SW
- 313 Wilkerson Rd SW
- 19 Berckman Ln SW
- 15 Alexander St
- 55 Ridgewood Rd SW
- 6 S Sycamore St SW
- 2 S Sycamore St SW
- 8 S Sycamore St SW
- 3 Fay St SW
- 3 Fay St SW
- 3 Fay St SW
- 1013 Shorter Ave SW
- 10 S Sycamore St SW
- 11 Fay St SW
- 7 S Sycamore St SW
- 12 S Sycamore St SW
- 13 Fay St SW
- 1014 Shorter Ave NW
- 1000 & 1010 Shorter Ave
- 100 S Sycamore St SW
- 1102 Shorter Ave NW
- 1103 Ethel Ave SW
- 102 S Sycamore St SW
- 1000 Shorter Ave NW
- 103 Fay St SW