4 S Tudor Ln Rogers, AR 72758
Estimated Value: $1,643,000 - $2,217,000
4
Beds
5
Baths
4,971
Sq Ft
$397/Sq Ft
Est. Value
About This Home
This home is located at 4 S Tudor Ln, Rogers, AR 72758 and is currently estimated at $1,974,041, approximately $397 per square foot. 4 S Tudor Ln is a home located in Benton County with nearby schools including Bellview Elementary School, Kirksey Middle School, and Rogers High School.
Ownership History
Date
Name
Owned For
Owner Type
Purchase Details
Closed on
Jun 29, 2021
Sold by
Zabal Elie R and Zabal Rosemary T
Bought by
Tore Omer and Tore Evren Pacalioglu
Current Estimated Value
Home Financials for this Owner
Home Financials are based on the most recent Mortgage that was taken out on this home.
Original Mortgage
$975,200
Outstanding Balance
$889,158
Interest Rate
3.5%
Mortgage Type
New Conventional
Estimated Equity
$1,084,883
Purchase Details
Closed on
Mar 21, 2011
Sold by
Fleming John and Fleming Shari
Bought by
Greenhouse Margaret E and Willingham Eric M
Home Financials for this Owner
Home Financials are based on the most recent Mortgage that was taken out on this home.
Original Mortgage
$760,000
Interest Rate
4.98%
Mortgage Type
New Conventional
Purchase Details
Closed on
Nov 16, 2004
Bought by
Johnny King Cnst
Create a Home Valuation Report for This Property
The Home Valuation Report is an in-depth analysis detailing your home's value as well as a comparison with similar homes in the area
Home Values in the Area
Average Home Value in this Area
Purchase History
| Date | Buyer | Sale Price | Title Company |
|---|---|---|---|
| Tore Omer | $1,405,000 | City Title & Closing | |
| Greenhouse Margaret E | $950,000 | Stewart Title Company | |
| Johnny King Cnst | $422,000 | -- |
Source: Public Records
Mortgage History
| Date | Status | Borrower | Loan Amount |
|---|---|---|---|
| Open | Tore Omer | $975,200 | |
| Previous Owner | Greenhouse Margaret E | $760,000 |
Source: Public Records
Tax History
| Year | Tax Paid | Tax Assessment Tax Assessment Total Assessment is a certain percentage of the fair market value that is determined by local assessors to be the total taxable value of land and additions on the property. | Land | Improvement |
|---|---|---|---|---|
| 2025 | $10,415 | $277,763 | $61,920 | $215,843 |
| 2024 | $9,700 | $277,763 | $61,920 | $215,843 |
| 2023 | $9,238 | $174,630 | $59,856 | $114,774 |
| 2022 | $9,230 | $174,630 | $59,856 | $114,774 |
| 2021 | $8,967 | $170,290 | $59,860 | $110,430 |
| 2020 | $9,765 | $177,870 | $35,160 | $142,710 |
| 2019 | $9,765 | $177,870 | $35,160 | $142,710 |
| 2018 | $9,415 | $177,870 | $35,160 | $142,710 |
| 2017 | $8,881 | $177,870 | $35,160 | $142,710 |
| 2016 | $8,881 | $177,870 | $35,160 | $142,710 |
| 2015 | $9,160 | $173,150 | $20,210 | $152,940 |
| 2014 | $8,810 | $173,150 | $20,210 | $152,940 |
Source: Public Records
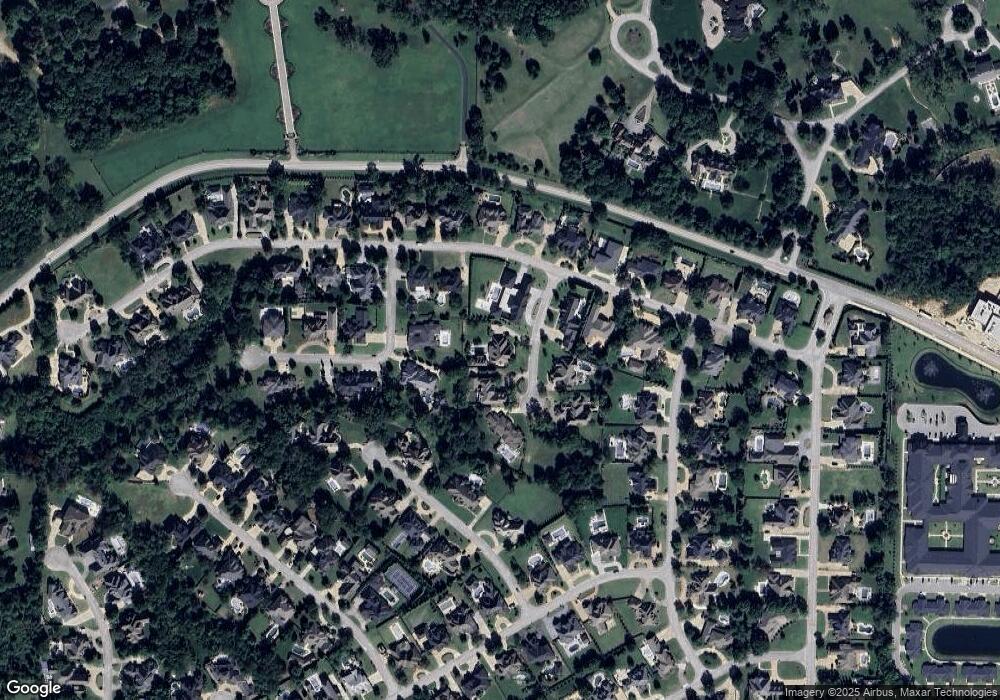
Map
Nearby Homes
- 10 S Plymouth Ln
- 11 Oxford Dr
- 24 S Windsor Dr
- 21 S Windsor Dr
- 46 W Buckingham Dr
- 8 S Newhaven Ct
- 9 S Clubhouse Dr
- 3915 S Champions Dr
- 3923 S Champions Dr
- 2 S Samoset Ct
- 4103 S Champions Dr Unit 17
- 4101 Champions Dr
- 4111 S Champions Dr
- 1 W Colonial Dr
- 1295 Sunbridge Ln
- 4 W Colonial Dr
- 5183 W Pauline Whitaker Pkwy
- 0 W Champions Blvd
- 1 S Saint Andrews Dr
- 31 W Champions Blvd
- 4 S Tudor Ln
- 7 S Tudor Ln
- 0 Tudor Ln Unit 494438
- 0 Tudor Ln Unit 570812
- 0 Tudor Ln Unit 1011269
- 6 Tudor Ln
- L692 Tudor Ln
- 14 Nottingham Ln
- 16 Nottingham Ln
- 3 Tudor Ln
- 3 S Tudor Ln
- 1 S Tudor Ln
- 3 S Queensborough Ln
- 18 Nottingham Ln
- 18 W Nottingham Ln
- 8 S Tudor Ln
- 5 S Queensborough Ln
- 10 W Nottingham Ln
- 20 W Nottingham Ln
- 5 Tudor Ln