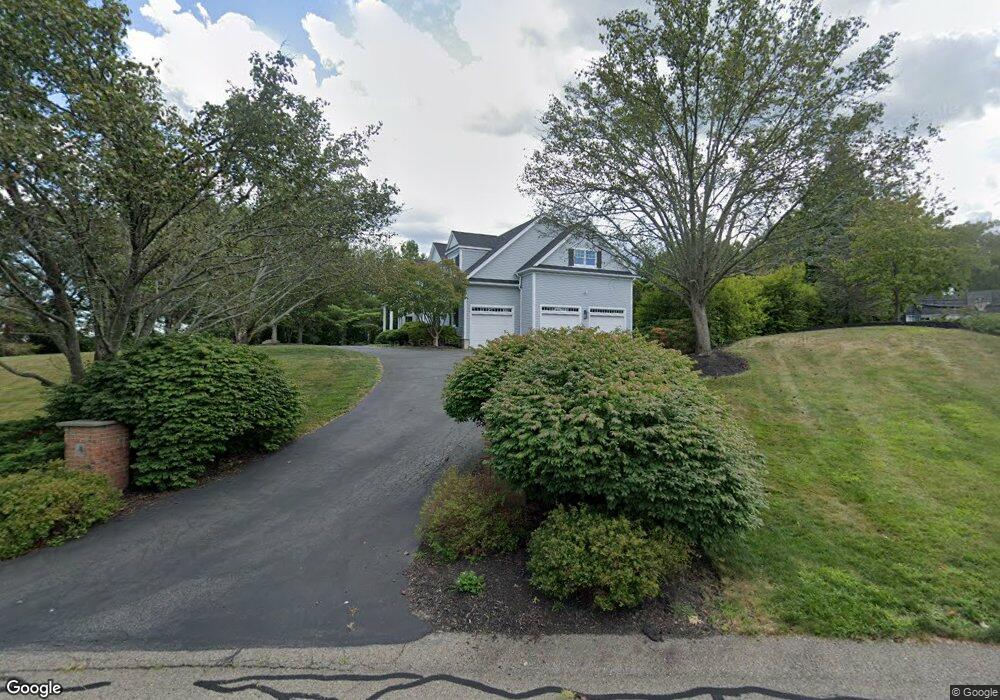
4 Sayles Rd Hingham, MA 02043
Estimated Value: $2,668,000 - $3,121,000
5
Beds
5
Baths
4,094
Sq Ft
$696/Sq Ft
Est. Value
About This Home
This home is located at 4 Sayles Rd, Hingham, MA 02043 and is currently estimated at $2,849,885, approximately $696 per square foot. 4 Sayles Rd is a home located in Plymouth County with nearby schools including Plymouth River Elementary School, Hingham Middle School, and Hingham High School.
Ownership History
Date
Name
Owned For
Owner Type
Purchase Details
Closed on
Apr 21, 2022
Sold by
Humber Scott and Humber Molly
Bought by
Oliwa Neil and Young-Oliwa Lori
Current Estimated Value
Home Financials for this Owner
Home Financials are based on the most recent Mortgage that was taken out on this home.
Original Mortgage
$1,820,000
Outstanding Balance
$1,692,948
Interest Rate
3.85%
Mortgage Type
Purchase Money Mortgage
Estimated Equity
$1,156,937
Purchase Details
Closed on
Jul 21, 2003
Sold by
Shepard Judith M
Bought by
Shepard Robert L and Shepard Judith M
Purchase Details
Closed on
Mar 3, 2003
Sold by
Shepard Robert L and Shepard Judith M
Bought by
Shepard Judith M
Create a Home Valuation Report for This Property
The Home Valuation Report is an in-depth analysis detailing your home's value as well as a comparison with similar homes in the area
Purchase History
| Date | Buyer | Sale Price | Title Company |
|---|---|---|---|
| Oliwa Neil | $2,275,000 | None Available | |
| Shepard Robert L | -- | -- | |
| Shepard Robert L | -- | -- | |
| Shepard Judith M | -- | -- | |
| Shepard Judith M | -- | -- |
Source: Public Records
Mortgage History
| Date | Status | Borrower | Loan Amount |
|---|---|---|---|
| Open | Oliwa Neil | $1,820,000 | |
| Previous Owner | Shepard Judith M | $400,000 |
Source: Public Records
Tax History
| Year | Tax Paid | Tax Assessment Tax Assessment Total Assessment is a certain percentage of the fair market value that is determined by local assessors to be the total taxable value of land and additions on the property. | Land | Improvement |
|---|---|---|---|---|
| 2025 | $26,473 | $2,476,400 | $794,700 | $1,681,700 |
| 2024 | $25,331 | $2,334,700 | $794,700 | $1,540,000 |
| 2023 | $22,304 | $2,230,400 | $794,700 | $1,435,700 |
| 2022 | $21,005 | $1,817,000 | $677,400 | $1,139,600 |
| 2021 | $20,452 | $1,733,200 | $677,400 | $1,055,800 |
| 2020 | $19,984 | $1,733,200 | $677,400 | $1,055,800 |
| 2019 | $19,711 | $1,669,000 | $677,400 | $991,600 |
| 2018 | $19,644 | $1,669,000 | $677,400 | $991,600 |
| 2017 | $19,033 | $1,553,700 | $673,200 | $880,500 |
| 2016 | $19,009 | $1,521,900 | $641,400 | $880,500 |
| 2015 | $18,598 | $1,484,300 | $631,200 | $853,100 |
Source: Public Records
Map
Nearby Homes
- 6 Brewer Way
- 10 Colby Rd
- 428 Main St
- 156 Fort Hill St
- 1 Hemlock Rd
- 7 Lewis Ct
- 168 Stayner Dr Unit 168
- 21 S Bradford Rd
- 21 Hersey St
- 19 Lantern Ln
- 6 Adams Ct
- 6 Leavitt St
- 225 South St Unit 1
- 14 Spring St
- 2 Black Rock Dr Unit 21
- 2 Black Rock Dr
- 32 Lazell St
- 1 Squirrel Hill Ln
- 70 Lazell St
- 32-70 Lazell St
Your Personal Tour Guide
Ask me questions while you tour the home.