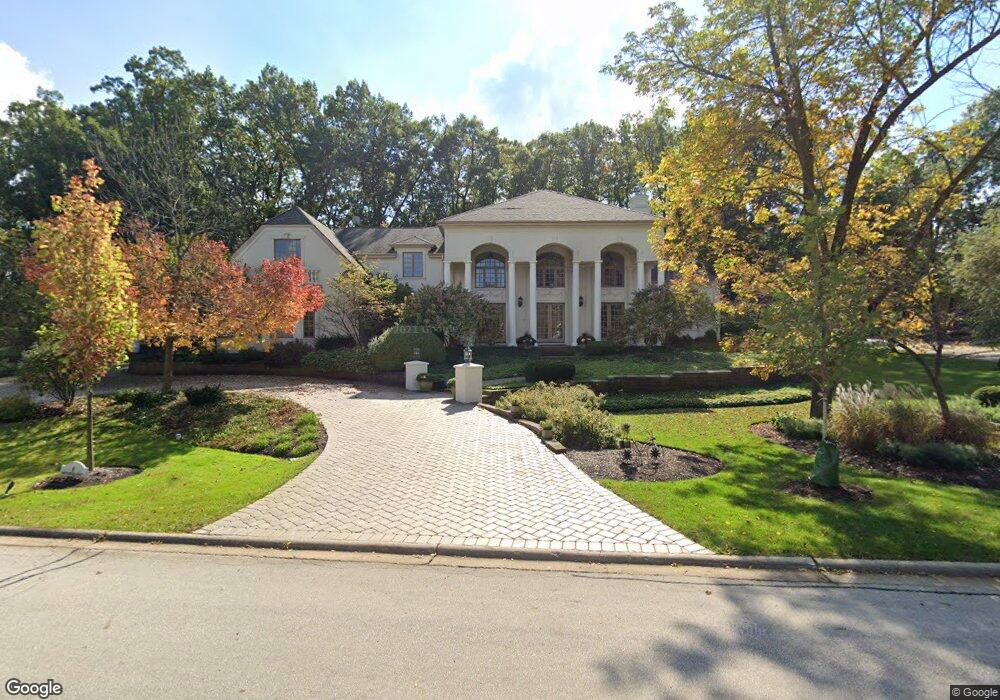
4 Shenandoah Ct Burr Ridge, IL 60527
Burr Ridge West NeighborhoodEstimated Value: $1,219,000 - $1,575,000
--
Bed
1
Bath
5,592
Sq Ft
$247/Sq Ft
Est. Value
About This Home
This home is located at 4 Shenandoah Ct, Burr Ridge, IL 60527 and is currently estimated at $1,381,222, approximately $246 per square foot. 4 Shenandoah Ct is a home located in DuPage County with nearby schools including Anne M. Jeans Elementary School, Burr Ridge Middle School, and Hinsdale South High School.
Ownership History
Date
Name
Owned For
Owner Type
Purchase Details
Closed on
May 30, 2017
Sold by
Anderson Craig M and Anderson Bridget M
Bought by
Anderson Craig M and Anderson Bridget M
Current Estimated Value
Purchase Details
Closed on
May 21, 1999
Sold by
Anthony Christopher and Anthony Evelyn T
Bought by
Anderson Craig and Anderson Bridget
Home Financials for this Owner
Home Financials are based on the most recent Mortgage that was taken out on this home.
Original Mortgage
$800,000
Outstanding Balance
$200,042
Interest Rate
6.65%
Estimated Equity
$1,181,180
Purchase Details
Closed on
Jun 9, 1997
Sold by
Patel Jayanti G and Patel Rama J
Bought by
Anthony Christopher and Anthony Evelyn T
Home Financials for this Owner
Home Financials are based on the most recent Mortgage that was taken out on this home.
Original Mortgage
$231,264
Interest Rate
8.5%
Create a Home Valuation Report for This Property
The Home Valuation Report is an in-depth analysis detailing your home's value as well as a comparison with similar homes in the area
Home Values in the Area
Average Home Value in this Area
Purchase History
| Date | Buyer | Sale Price | Title Company |
|---|---|---|---|
| Anderson Craig M | -- | Attorney | |
| Anderson Craig | $930,000 | Intercounty Title | |
| Anthony Christopher | $237,500 | -- |
Source: Public Records
Mortgage History
| Date | Status | Borrower | Loan Amount |
|---|---|---|---|
| Open | Anderson Craig | $800,000 | |
| Previous Owner | Anthony Christopher | $231,264 |
Source: Public Records
Tax History Compared to Growth
Tax History
| Year | Tax Paid | Tax Assessment Tax Assessment Total Assessment is a certain percentage of the fair market value that is determined by local assessors to be the total taxable value of land and additions on the property. | Land | Improvement |
|---|---|---|---|---|
| 2024 | $22,267 | $398,526 | $135,975 | $262,551 |
| 2023 | $21,416 | $366,360 | $125,000 | $241,360 |
| 2022 | $21,946 | $378,510 | $128,730 | $249,780 |
| 2021 | $20,422 | $374,210 | $127,270 | $246,940 |
| 2020 | $20,095 | $366,800 | $124,750 | $242,050 |
| 2019 | $19,597 | $351,950 | $119,700 | $232,250 |
| 2018 | $20,210 | $376,460 | $119,040 | $257,420 |
| 2017 | $20,236 | $355,060 | $114,550 | $240,510 |
| 2016 | $19,771 | $338,860 | $109,320 | $229,540 |
| 2015 | $19,768 | $318,810 | $102,850 | $215,960 |
| 2014 | $18,758 | $298,090 | $100,000 | $198,090 |
| 2013 | $18,161 | $296,690 | $99,530 | $197,160 |
Source: Public Records
Map
Nearby Homes
- 8850 S County Line Rd
- 8886 Johnston Rd
- 8980 Enclave Dr
- 11901 Heritage Dr
- 1 Hidden Lake Dr
- 430 Westminster Dr
- 15 Laurel Oak Ct
- 11735 Orchard Rd
- 15W601 89th Place
- 15W601 S Grant St
- 10S641 S Garfield Ave
- 11665 Orchard Rd
- 10S641 Garfield Ave
- 15W740 90th St
- 9032 Wolf Rd
- 122 Santa fe Ln
- 4 Keri Ln
- 10S370 Madison St
- 8141 Ridgepoint Dr
- 8101 S County Line Rd
- 145 Glenmora Dr
- 6 Shenandoah Ct
- 135 Glenmora Dr
- 3 Shenandoah Ct
- 8814 Shenandoah Ln
- 5 Shenandoah Ct
- 8804 Shenandoah Ln
- Lot 5 Glenmora Dr
- Lot 16 Glenmora Dr
- 8824 Shenandoah Ln
- 8 Shenandoah Ct
- 125 Glenmora Dr
- 1 Shenandoah Ct
- 11S360 Madison St
- 7 Shenandoah Ct
- 160 Glenmora Dr
- 140 Glenmora Dr
- 150 Glenmora Dr
- 8821 Wedgewood Dr
- 8811 Wedgewood Dr