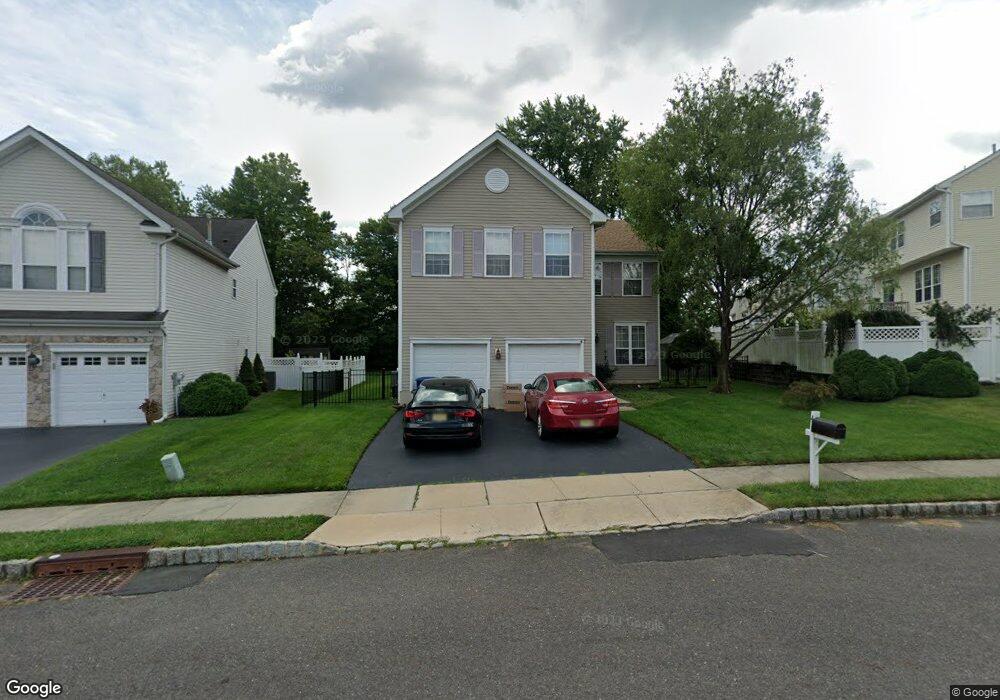
4 Shenandoah Place Columbus, NJ 08022
Estimated Value: $596,275
--
Bed
--
Bath
2,294
Sq Ft
$260/Sq Ft
Est. Value
About This Home
This home is located at 4 Shenandoah Place, Columbus, NJ 08022 and is currently estimated at $596,275, approximately $259 per square foot. 4 Shenandoah Place is a home located in Burlington County with nearby schools including John Hydock Elementary School, Mansfield Township Elementary School, and Northern Burlington County Regional Middle School.
Ownership History
Date
Name
Owned For
Owner Type
Purchase Details
Closed on
Jan 29, 2007
Sold by
Gowin Dwight J and Gowin Katrina
Bought by
Corbin Kenneth D and Corbin Nelesha L
Current Estimated Value
Home Financials for this Owner
Home Financials are based on the most recent Mortgage that was taken out on this home.
Original Mortgage
$382,189
Outstanding Balance
$228,915
Interest Rate
6.16%
Mortgage Type
VA
Estimated Equity
$367,360
Create a Home Valuation Report for This Property
The Home Valuation Report is an in-depth analysis detailing your home's value as well as a comparison with similar homes in the area
Home Values in the Area
Average Home Value in this Area
Purchase History
| Date | Buyer | Sale Price | Title Company |
|---|---|---|---|
| Corbin Kenneth D | $375,000 | Congress Title |
Source: Public Records
Mortgage History
| Date | Status | Borrower | Loan Amount |
|---|---|---|---|
| Open | Corbin Kenneth D | $382,189 |
Source: Public Records
Tax History Compared to Growth
Tax History
| Year | Tax Paid | Tax Assessment Tax Assessment Total Assessment is a certain percentage of the fair market value that is determined by local assessors to be the total taxable value of land and additions on the property. | Land | Improvement |
|---|---|---|---|---|
| 2025 | -- | $236,500 | $65,700 | $170,800 |
| 2024 | -- | $236,500 | $65,700 | $170,800 |
| 2023 | $7,807 | $236,500 | $65,700 | $170,800 |
| 2022 | $7,807 | $236,500 | $65,700 | $170,800 |
| 2021 | $7,720 | $236,500 | $65,700 | $170,800 |
| 2020 | $7,885 | $236,500 | $65,700 | $170,800 |
| 2019 | $7,691 | $236,500 | $65,700 | $170,800 |
| 2018 | $7,374 | $236,500 | $65,700 | $170,800 |
| 2017 | $7,119 | $236,500 | $65,700 | $170,800 |
| 2016 | $7,124 | $236,500 | $65,700 | $170,800 |
| 2015 | $7,048 | $236,500 | $65,700 | $170,800 |
| 2014 | $6,746 | $236,500 | $65,700 | $170,800 |
Source: Public Records
Map
Nearby Homes
- 5 Foster Ln
- 5 Pheasant Ct
- 51 Lincoln Dr
- 3 Jasper Dr
- 43 Barbary Ln
- 49 Chamber Ln
- 87 Chamber Ln
- 25 Ellington Dr
- 36 White Pine Rd
- 0 Bordentown Georgetown Rd
- 199 Bordentown Georgetown Rd
- 36 Chesterfield Rd
- 28546 School House Rd
- 145 White Pine Rd
- 17 Belmont Cir
- 8 Sherwood Ln
- 27058 Mount Pleasant Rd
- 183 Bordentown Georgetown Rd
- 36 Chest-Georgetown Rd
- 58 Sykesville Rd
- 6 Shenandoah Place
- 12 Lincoln Dr
- 10 Lincoln Dr
- 8 Shenandoah Place
- 8 Lincoln Dr
- 3 Shenandoah Place
- 1 Shenandoah Place
- 10 Shenandoah Place
- 5 Shenandoah Place
- 6 Lincoln Dr
- 7 Shenandoah Place
- 11 Lincoln Dr
- 13 Lincoln Dr
- 9 Lincoln Dr
- 15 Lincoln Dr
- 4 Lincoln Dr
- 12 Shenandoah Place
- 9 Shenandoah Place
- 2 Juniper Dr
- 37 Greenbrook Dr