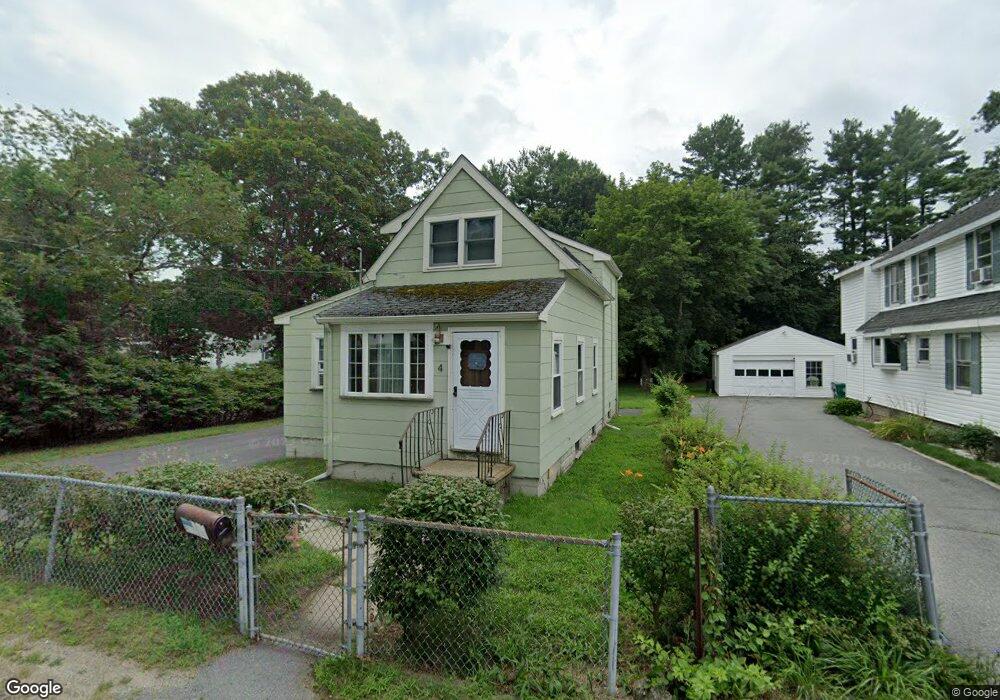
4 Sheridan St Billerica, MA 01821
Pinehurst NeighborhoodEstimated Value: $480,000 - $538,000
2
Beds
1
Bath
1,084
Sq Ft
$464/Sq Ft
Est. Value
About This Home
This home is located at 4 Sheridan St, Billerica, MA 01821 and is currently estimated at $502,842, approximately $463 per square foot. 4 Sheridan St is a home located in Middlesex County with nearby schools including Billerica Memorial High School, Mount Hope Christian School, and Burlington Montessori School.
Ownership History
Date
Name
Owned For
Owner Type
Purchase Details
Closed on
Dec 21, 2022
Sold by
Lapham Budd
Bought by
Lapham Family 2022 Ret and Lapham
Current Estimated Value
Purchase Details
Closed on
May 31, 2005
Sold by
Coulibaly Donna and Coulibaly Dramane
Bought by
Lapham Budd John
Home Financials for this Owner
Home Financials are based on the most recent Mortgage that was taken out on this home.
Original Mortgage
$209,000
Interest Rate
5.94%
Mortgage Type
Purchase Money Mortgage
Purchase Details
Closed on
Aug 13, 1996
Sold by
Hickey Ft and Shopel
Bought by
Coulibaly Dramane and Coulibaly Donna
Home Financials for this Owner
Home Financials are based on the most recent Mortgage that was taken out on this home.
Original Mortgage
$38,000
Interest Rate
8.24%
Mortgage Type
Purchase Money Mortgage
Create a Home Valuation Report for This Property
The Home Valuation Report is an in-depth analysis detailing your home's value as well as a comparison with similar homes in the area
Home Values in the Area
Average Home Value in this Area
Purchase History
| Date | Buyer | Sale Price | Title Company |
|---|---|---|---|
| Lapham Family 2022 Ret | -- | None Available | |
| Lapham Budd John | $269,000 | -- | |
| Coulibaly Dramane | $40,000 | -- |
Source: Public Records
Mortgage History
| Date | Status | Borrower | Loan Amount |
|---|---|---|---|
| Previous Owner | Coulibaly Dramane | $247,000 | |
| Previous Owner | Lapham Budd John | $209,000 | |
| Previous Owner | Coulibaly Dramane | $10,816 | |
| Previous Owner | Coulibaly Dramane | $38,000 |
Source: Public Records
Tax History Compared to Growth
Tax History
| Year | Tax Paid | Tax Assessment Tax Assessment Total Assessment is a certain percentage of the fair market value that is determined by local assessors to be the total taxable value of land and additions on the property. | Land | Improvement |
|---|---|---|---|---|
| 2025 | $4,548 | $400,000 | $274,500 | $125,500 |
| 2024 | $4,304 | $381,200 | $270,700 | $110,500 |
| 2023 | $4,089 | $344,500 | $234,000 | $110,500 |
| 2022 | $3,787 | $299,600 | $201,700 | $97,900 |
| 2021 | $3,602 | $277,100 | $176,300 | $100,800 |
| 2020 | $3,510 | $270,200 | $169,400 | $100,800 |
| 2019 | $3,499 | $259,600 | $169,400 | $90,200 |
| 2018 | $3,333 | $234,900 | $149,000 | $85,900 |
| 2017 | $3,198 | $227,000 | $149,000 | $78,000 |
| 2016 | $3,026 | $214,000 | $137,700 | $76,300 |
| 2015 | $2,833 | $201,800 | $125,500 | $76,300 |
| 2014 | $2,867 | $200,600 | $126,700 | $73,900 |
Source: Public Records
Map
Nearby Homes
- 791 Boston Rd
- 3 Cardington Ave
- 34 Glenvale Ave
- 17 Glenvale Ave
- 46 Riverbank Terrace
- 12 Ridgeway Ave
- 42 Pinehurst Ave
- 17 Ben Place
- 0 Bedford St
- 5 Francis Wyman Rd
- 14 Saint Marys Rd
- 8 Leroy Dr
- 94 Pinedale Ave
- 10 Scroxton Dr
- 5 Munroe Way
- 11 Bicknell Rd
- 2 Stephanie St
- 20 Alma Rd
- 1 Harvard Ave
- 345 Cambridge St