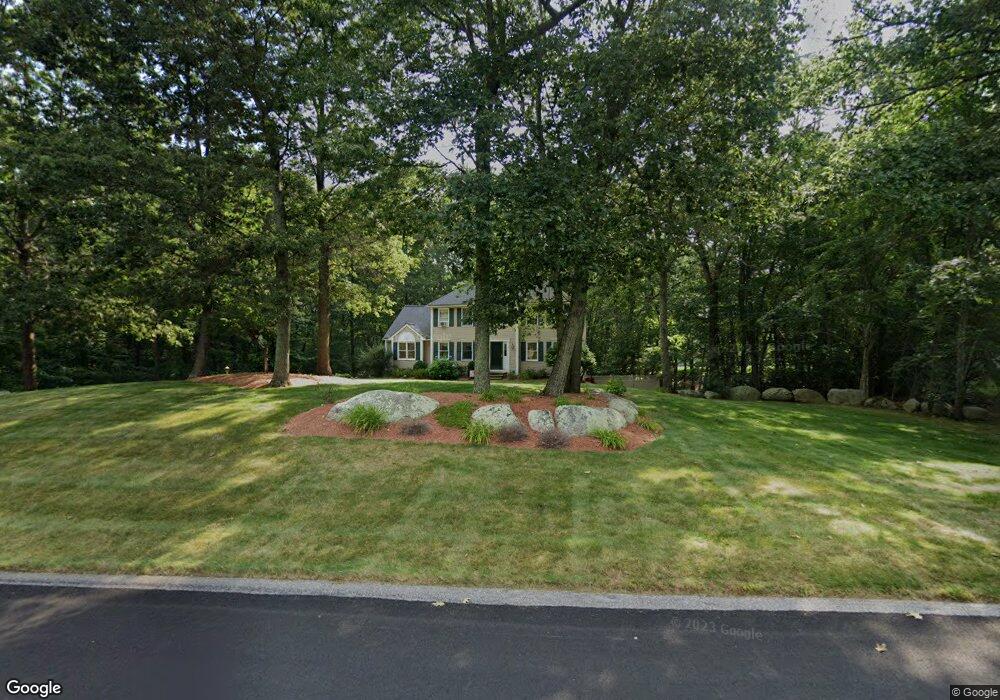
4 Short St Medway, MA 02053
Estimated Value: $752,000 - $903,000
4
Beds
3
Baths
2,266
Sq Ft
$361/Sq Ft
Est. Value
About This Home
This home is located at 4 Short St, Medway, MA 02053 and is currently estimated at $818,633, approximately $361 per square foot. 4 Short St is a home located in Norfolk County with nearby schools including John D. McGovern Elementary School, Burke-Memorial Elementary, and Medway Middle School.
Ownership History
Date
Name
Owned For
Owner Type
Purchase Details
Closed on
Sep 19, 2008
Sold by
Rowe David M and Rowe Donna M
Bought by
4 Short Street Rt and Rowe David M
Current Estimated Value
Purchase Details
Closed on
May 29, 1997
Sold by
Tw Caplis Inc
Bought by
Rowe David M and Rowe Donn Am
Home Financials for this Owner
Home Financials are based on the most recent Mortgage that was taken out on this home.
Original Mortgage
$220,000
Interest Rate
8.09%
Mortgage Type
Purchase Money Mortgage
Create a Home Valuation Report for This Property
The Home Valuation Report is an in-depth analysis detailing your home's value as well as a comparison with similar homes in the area
Home Values in the Area
Average Home Value in this Area
Purchase History
| Date | Buyer | Sale Price | Title Company |
|---|---|---|---|
| 4 Short Street Rt | -- | -- | |
| Rowe David M | $251,400 | -- |
Source: Public Records
Mortgage History
| Date | Status | Borrower | Loan Amount |
|---|---|---|---|
| Previous Owner | Rowe David M | $208,000 | |
| Previous Owner | Rowe David M | $219,000 | |
| Previous Owner | Rowe David M | $208,000 | |
| Previous Owner | Rowe David M | $220,000 |
Source: Public Records
Tax History
| Year | Tax Paid | Tax Assessment Tax Assessment Total Assessment is a certain percentage of the fair market value that is determined by local assessors to be the total taxable value of land and additions on the property. | Land | Improvement |
|---|---|---|---|---|
| 2025 | $9,770 | $685,600 | $340,000 | $345,600 |
| 2024 | $9,873 | $685,600 | $340,000 | $345,600 |
| 2023 | $9,760 | $612,300 | $309,500 | $302,800 |
| 2022 | $8,685 | $513,000 | $228,900 | $284,100 |
| 2021 | $8,559 | $490,200 | $213,600 | $276,600 |
| 2020 | $8,383 | $479,000 | $213,600 | $265,400 |
| 2019 | $7,905 | $465,800 | $204,900 | $260,900 |
| 2018 | $7,954 | $450,400 | $196,200 | $254,200 |
| 2017 | $7,913 | $441,600 | $191,900 | $249,700 |
| 2016 | $7,813 | $431,400 | $176,600 | $254,800 |
| 2015 | $7,745 | $424,600 | $174,400 | $250,200 |
| 2014 | $7,907 | $419,700 | $174,600 | $245,100 |
Source: Public Records
Map
Nearby Homes
- 8 Liberty Rd
- 78 Fisher St
- 23 Clark St
- 56 Fisher St
- 15 Fox Run Rd
- 22 Granite St
- 23 Cedar Farms Rd
- 39 West St
- 6 Kingson Ln Unit 2
- 190-194 E Main St
- 462 Hartford Ave
- 6 Freedom Trail
- 15 Black Bear Cir Unit 15
- 13 Black Bear Cir Unit 13
- 11 Black Bear Unit 11
- 46 Black Bear Cir Unit 46
- 9 Black Bear Cir Unit 9
- 48 Black Bear Cir Unit 48
- 43 Black Bear Cir Unit 43
- 7 Black Bear Unit 7
Your Personal Tour Guide
Ask me questions while you tour the home.