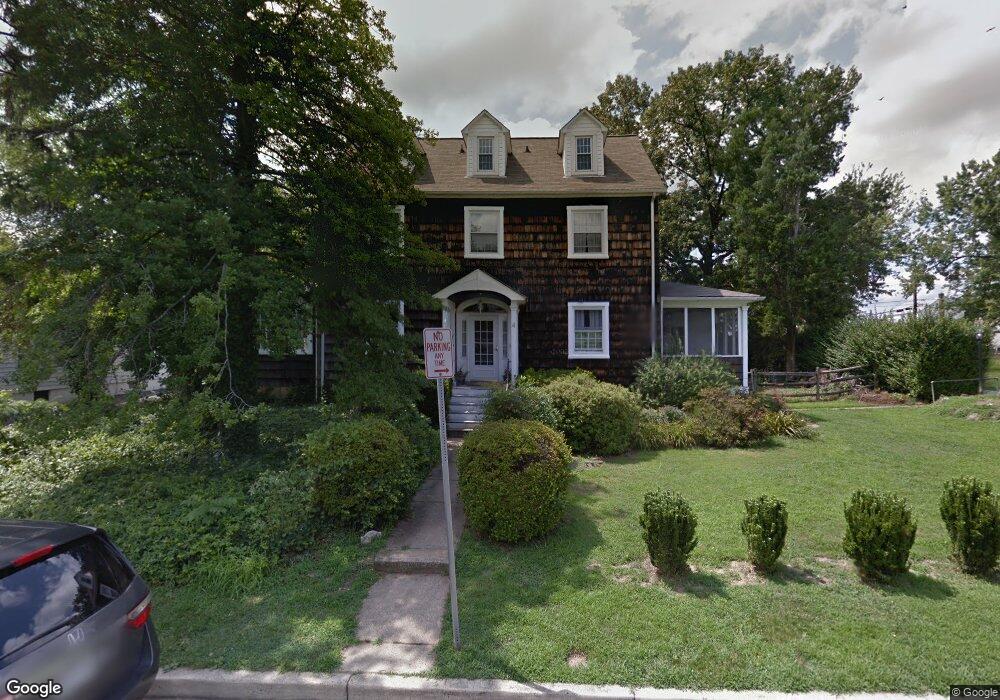
4 Sipple Ave Nottingham, MD 21236
Estimated Value: $288,000 - $377,000
--
Bed
1
Bath
2,560
Sq Ft
$132/Sq Ft
Est. Value
About This Home
This home is located at 4 Sipple Ave, Nottingham, MD 21236 and is currently estimated at $337,696, approximately $131 per square foot. 4 Sipple Ave is a home located in Baltimore County with nearby schools including Fullerton Elementary School, Parkville Middle & Center of Technology, and Overlea High School.
Ownership History
Date
Name
Owned For
Owner Type
Purchase Details
Closed on
Dec 17, 2007
Sold by
Bathurst Jeffrey M
Bought by
Wesloski Neal and Wesloski Amy
Current Estimated Value
Home Financials for this Owner
Home Financials are based on the most recent Mortgage that was taken out on this home.
Original Mortgage
$50,625
Outstanding Balance
$34,836
Interest Rate
8.25%
Mortgage Type
Stand Alone Second
Estimated Equity
$302,860
Purchase Details
Closed on
Nov 30, 2007
Sold by
Bathurst Jeffrey M
Bought by
Wesloski Neal and Wesloski Amy
Home Financials for this Owner
Home Financials are based on the most recent Mortgage that was taken out on this home.
Original Mortgage
$50,625
Outstanding Balance
$34,836
Interest Rate
8.25%
Mortgage Type
Stand Alone Second
Estimated Equity
$302,860
Purchase Details
Closed on
Mar 22, 1999
Sold by
Bathurst Jeffrey M
Bought by
Bathurst Jeffrey M and Bathurst Johanna
Create a Home Valuation Report for This Property
The Home Valuation Report is an in-depth analysis detailing your home's value as well as a comparison with similar homes in the area
Home Values in the Area
Average Home Value in this Area
Purchase History
| Date | Buyer | Sale Price | Title Company |
|---|---|---|---|
| Wesloski Neal | $337,500 | -- | |
| Wesloski Neal | $337,500 | -- | |
| Bathurst Jeffrey M | -- | -- |
Source: Public Records
Mortgage History
| Date | Status | Borrower | Loan Amount |
|---|---|---|---|
| Open | Wesloski Neal | $50,625 | |
| Open | Wesloski Neal | $270,000 | |
| Closed | Wesloski Neal | $50,625 | |
| Closed | Wesloski Neal | $270,000 |
Source: Public Records
Tax History Compared to Growth
Tax History
| Year | Tax Paid | Tax Assessment Tax Assessment Total Assessment is a certain percentage of the fair market value that is determined by local assessors to be the total taxable value of land and additions on the property. | Land | Improvement |
|---|---|---|---|---|
| 2025 | $2,913 | $211,000 | -- | -- |
| 2024 | $2,913 | $195,600 | $0 | $0 |
| 2023 | $1,340 | $180,200 | $79,500 | $100,700 |
| 2022 | $2,586 | $178,333 | $0 | $0 |
| 2021 | $2,518 | $176,467 | $0 | $0 |
| 2020 | $2,518 | $174,600 | $79,500 | $95,100 |
| 2019 | $2,869 | $174,400 | $0 | $0 |
| 2018 | $2,767 | $174,200 | $0 | $0 |
| 2017 | $2,645 | $174,000 | $0 | $0 |
| 2016 | $3,104 | $173,533 | $0 | $0 |
| 2015 | $3,104 | $173,067 | $0 | $0 |
| 2014 | $3,104 | $172,600 | $0 | $0 |
Source: Public Records
Map
Nearby Homes
- 4 Elinor Ave
- 48 Lyndale Ave
- 5127 Terrace Dr
- 7501 Kenlea Ave
- 301 3rd St
- 9 Glenmore Ave
- 4305 Fullerton Ave
- 34 Henry Ave
- 4213 Hazel Ave
- 702 Dale Ave
- 4514 Kenwood Ave
- 626 Dale Ave
- 24 Henry Ave
- 615 Old Home Rd
- 4222 Thorncliff Rd
- 4209 Cardwell Ave
- 4 W Overlea Ave
- 24 Fullerton Heights Ave
- 4315 Belmar Ave
- 4 Sundown Ct