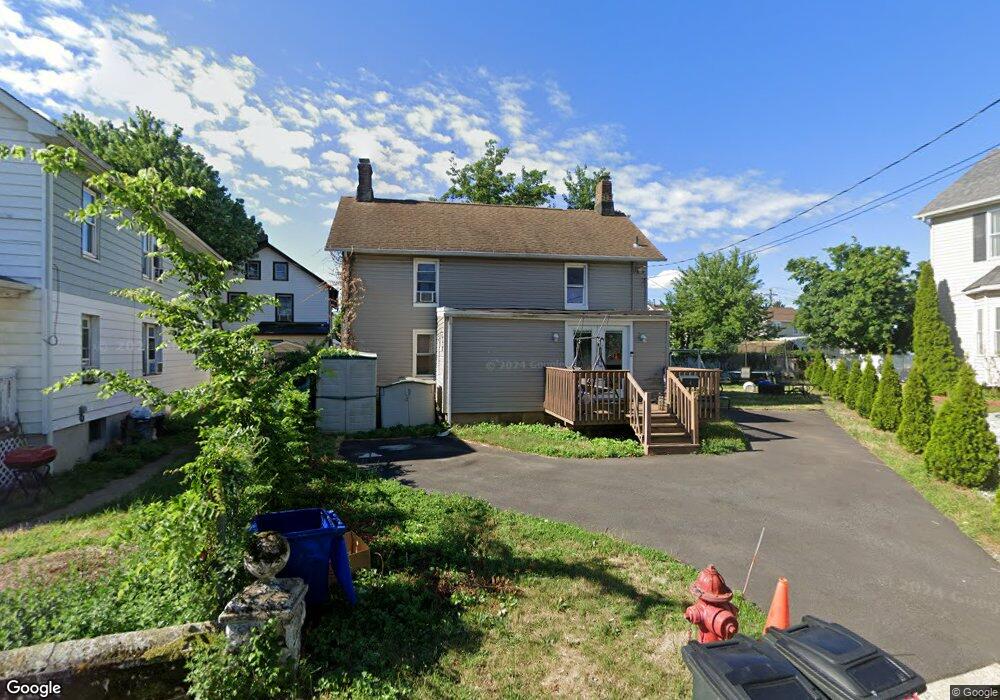
4 Snyder Ln Keyport, NJ 07735
Estimated Value: $464,182 - $514,000
3
Beds
1
Bath
1,532
Sq Ft
$316/Sq Ft
Est. Value
About This Home
This home is located at 4 Snyder Ln, Keyport, NJ 07735 and is currently estimated at $483,796, approximately $315 per square foot. 4 Snyder Ln is a home located in Monmouth County with nearby schools including Keyport Central School, Keyport High School, and Icob Academy.
Ownership History
Date
Name
Owned For
Owner Type
Purchase Details
Closed on
Dec 2, 2010
Sold by
Mccague Charles
Bought by
Wickham Anthony and Wickham Ann
Current Estimated Value
Home Financials for this Owner
Home Financials are based on the most recent Mortgage that was taken out on this home.
Original Mortgage
$150,967
Outstanding Balance
$101,153
Interest Rate
4.5%
Mortgage Type
FHA
Estimated Equity
$382,643
Purchase Details
Closed on
Dec 9, 2009
Sold by
Mccague Charles and Sheridan Bernard
Bought by
Jv Homebuilders Corp
Purchase Details
Closed on
Jun 23, 2009
Sold by
Mccague Charles and Sheridan Bernard
Bought by
Mccague Charles and Sheridan Bernard
Purchase Details
Closed on
Dec 2, 1999
Sold by
Us Of American By Va
Bought by
Walsh Luke
Home Financials for this Owner
Home Financials are based on the most recent Mortgage that was taken out on this home.
Original Mortgage
$59,400
Interest Rate
7.83%
Create a Home Valuation Report for This Property
The Home Valuation Report is an in-depth analysis detailing your home's value as well as a comparison with similar homes in the area
Home Values in the Area
Average Home Value in this Area
Purchase History
| Date | Buyer | Sale Price | Title Company |
|---|---|---|---|
| Wickham Anthony | $153,000 | Red Bank Title Agency Inc | |
| Jv Homebuilders Corp | $82,500 | Red Bank Title Agency Inc | |
| Mccague Charles | -- | Scott Title Services Llc | |
| Walsh Luke | $62,575 | -- |
Source: Public Records
Mortgage History
| Date | Status | Borrower | Loan Amount |
|---|---|---|---|
| Open | Wickham Anthony | $150,967 | |
| Previous Owner | Walsh Luke | $59,400 |
Source: Public Records
Tax History Compared to Growth
Tax History
| Year | Tax Paid | Tax Assessment Tax Assessment Total Assessment is a certain percentage of the fair market value that is determined by local assessors to be the total taxable value of land and additions on the property. | Land | Improvement |
|---|---|---|---|---|
| 2025 | $7,307 | $408,400 | $198,100 | $210,300 |
| 2024 | $7,201 | $353,000 | $159,000 | $194,000 |
| 2023 | $7,201 | $327,600 | $144,500 | $183,100 |
| 2022 | $5,971 | $284,900 | $125,700 | $159,200 |
| 2021 | $5,971 | $251,500 | $109,300 | $142,200 |
| 2020 | $6,068 | $238,600 | $103,400 | $135,200 |
| 2019 | $5,888 | $231,900 | $99,900 | $132,000 |
| 2018 | $5,600 | $215,400 | $91,900 | $123,500 |
| 2017 | $5,655 | $216,900 | $94,900 | $122,000 |
| 2016 | $5,447 | $210,700 | $94,900 | $115,800 |
| 2015 | $5,303 | $204,200 | $89,900 | $114,300 |
| 2014 | $4,498 | $174,900 | $51,500 | $123,400 |
Source: Public Records
Map
Nearby Homes