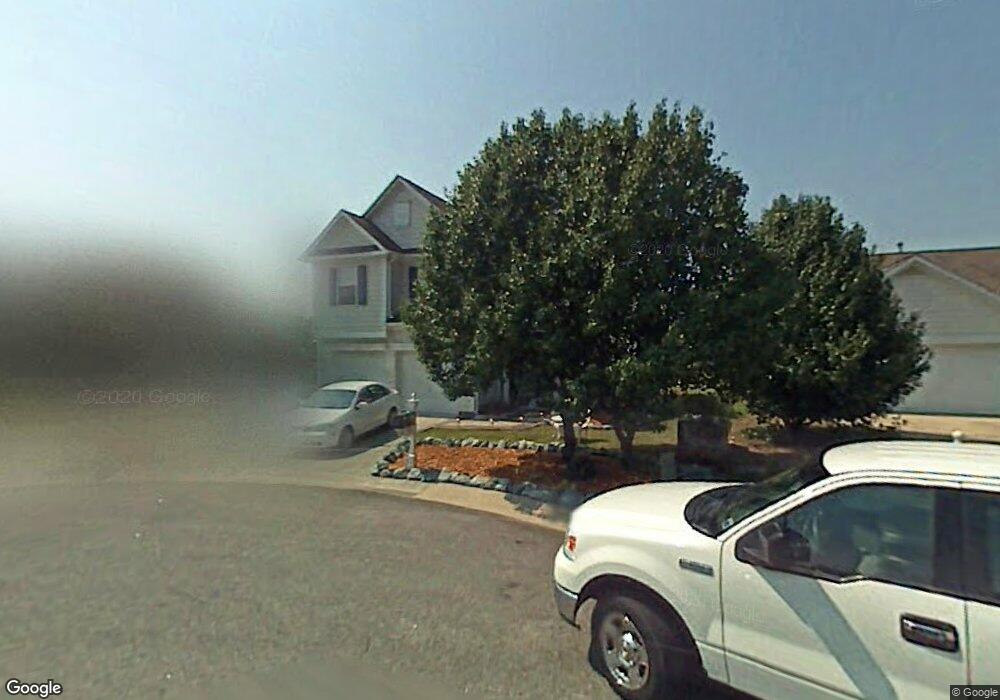
4 Spinnaker Ct Durham, NC 27703
Eastern Durham NeighborhoodEstimated Value: $397,379 - $418,000
3
Beds
3
Baths
1,675
Sq Ft
$243/Sq Ft
Est. Value
About This Home
This home is located at 4 Spinnaker Ct, Durham, NC 27703 and is currently estimated at $406,345, approximately $242 per square foot. 4 Spinnaker Ct is a home located in Durham County with nearby schools including Oak Grove Elementary, John W Neal Middle School, and Southern School of Energy & Sustainability.
Ownership History
Date
Name
Owned For
Owner Type
Purchase Details
Closed on
Mar 21, 2019
Sold by
Hill Linnette
Bought by
Hill Robert and Hill Linnette
Current Estimated Value
Home Financials for this Owner
Home Financials are based on the most recent Mortgage that was taken out on this home.
Original Mortgage
$142,605
Outstanding Balance
$125,374
Interest Rate
4.4%
Mortgage Type
VA
Estimated Equity
$280,971
Purchase Details
Closed on
Apr 7, 2005
Sold by
Nackley Samuel James
Bought by
Hill Linnette
Home Financials for this Owner
Home Financials are based on the most recent Mortgage that was taken out on this home.
Original Mortgage
$173,900
Interest Rate
8.65%
Mortgage Type
Purchase Money Mortgage
Purchase Details
Closed on
Apr 26, 1999
Sold by
D R Horton Inc Torrey
Bought by
Nackley Samuel James
Home Financials for this Owner
Home Financials are based on the most recent Mortgage that was taken out on this home.
Original Mortgage
$138,163
Interest Rate
7.13%
Create a Home Valuation Report for This Property
The Home Valuation Report is an in-depth analysis detailing your home's value as well as a comparison with similar homes in the area
Home Values in the Area
Average Home Value in this Area
Purchase History
| Date | Buyer | Sale Price | Title Company |
|---|---|---|---|
| Hill Robert | -- | None Available | |
| Hill Linnette | $174,000 | -- | |
| Nackley Samuel James | $154,000 | -- |
Source: Public Records
Mortgage History
| Date | Status | Borrower | Loan Amount |
|---|---|---|---|
| Open | Hill Robert | $142,605 | |
| Closed | Hill Linnette | $173,900 | |
| Previous Owner | Nackley Samuel James | $138,163 |
Source: Public Records
Tax History
| Year | Tax Paid | Tax Assessment Tax Assessment Total Assessment is a certain percentage of the fair market value that is determined by local assessors to be the total taxable value of land and additions on the property. | Land | Improvement |
|---|---|---|---|---|
| 2025 | $3,399 | $387,840 | $57,610 | $330,230 |
| 2024 | $2,432 | $219,325 | $37,867 | $181,458 |
| 2023 | $2,283 | $219,325 | $37,867 | $181,458 |
| 2022 | $2,231 | $219,325 | $37,867 | $181,458 |
| 2021 | $2,221 | $219,325 | $37,867 | $181,458 |
| 2020 | $2,168 | $219,325 | $37,867 | $181,458 |
| 2019 | $2,168 | $219,325 | $37,867 | $181,458 |
| 2018 | $1,742 | $173,429 | $36,465 | $136,964 |
| 2017 | $1,729 | $173,429 | $36,465 | $136,964 |
| 2016 | $1,671 | $173,429 | $36,465 | $136,964 |
| 2015 | $1,803 | $175,228 | $35,766 | $139,462 |
| 2014 | $1,803 | $175,228 | $35,766 | $139,462 |
Source: Public Records
Map
Nearby Homes
- 2117 Fletchers Ridge Dr
- 604 Bellmeade Bay Dr
- 208 Lick Creek Ln
- 516 Guy Walker Way
- 110 Kindlewood Dr
- 442 Gus Rd
- 107 Crosswood Dr
- 517 Keith St
- 416 Chivalry Dr
- 907 Danbury Dr
- 2800-2809 Napoli Dr
- 210 Stoney Creek Cir
- 1315 Pennock Rd
- 17 Plumleaf Ln
- 528 Plumleaf Ln
- The Poplar Plan at Sherron Road Townes
- 13 Blackthorn Ln
- 807 Outlaw Ave
- 1114 Blackthorn Ln
- 807 Outlaw Ave Unit 19
- 2 Spinnaker Ct
- 6 Spinnaker Ct
- 307 Winward Pointe Dr
- 10 Spinnaker Ct
- 311 Winward Pointe Dr
- 9 Spinnaker Ct
- 313 Winward Pointe Dr
- 1 Spinnaker Ct
- WE485 Winward Pointe Dr
- 304 Winward Pointe Dr
- 3 Spinnaker Ct
- 306 Winward Pointe Dr
- 5 Spinnaker Ct
- 302 Winward Pointe Dr
- 308 Winward Pointe Dr
- 505 N Waters Edge Dr
- 507 N Waters Edge Dr
- 511 N Waters Edge Dr
- 312 Winward Pointe Dr
- 503 N Waters Edge Dr