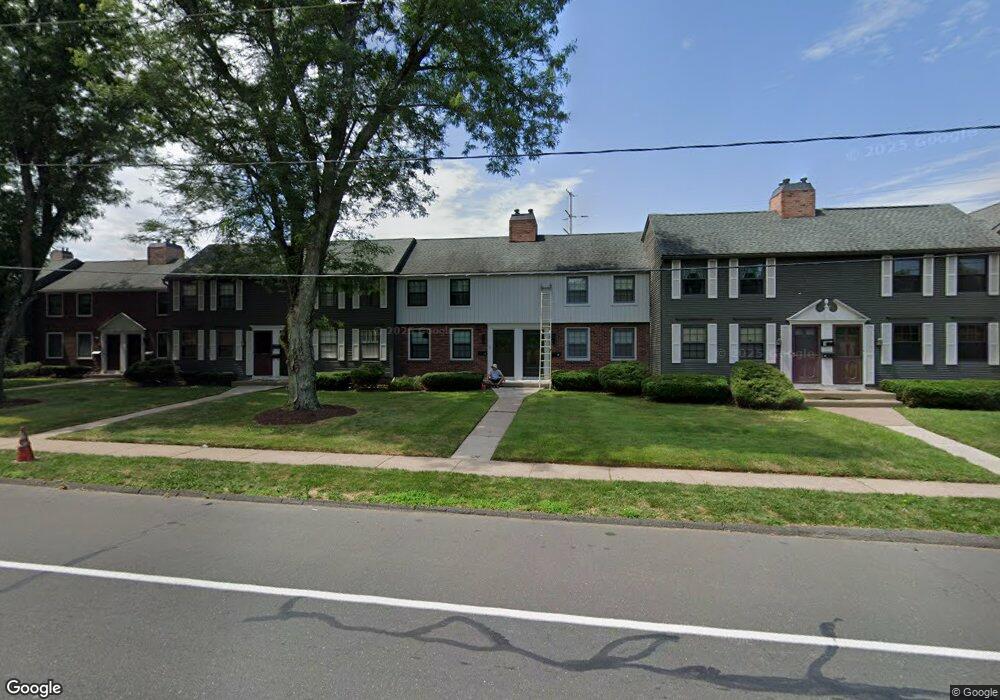
4 Spring St Wethersfield, CT 06109
Estimated Value: $240,000 - $251,097
2
Beds
2
Baths
1,026
Sq Ft
$239/Sq Ft
Est. Value
About This Home
This home is located at 4 Spring St, Wethersfield, CT 06109 and is currently estimated at $245,274, approximately $239 per square foot. 4 Spring St is a home located in Hartford County with nearby schools including Alfred W. Hanmer School, Silas Deane Middle School, and Wethersfield High School.
Ownership History
Date
Name
Owned For
Owner Type
Purchase Details
Closed on
Sep 19, 2023
Sold by
Knott-Twine Laura
Bought by
Lobo Fatima T
Current Estimated Value
Purchase Details
Closed on
Oct 11, 2018
Sold by
Wharto Donald L
Bought by
Reis Carolyn
Purchase Details
Closed on
Jul 1, 2010
Sold by
Ls Home Enterprises Ll
Bought by
Knott-Twine Laura
Home Financials for this Owner
Home Financials are based on the most recent Mortgage that was taken out on this home.
Original Mortgage
$151,490
Interest Rate
4.88%
Mortgage Type
Purchase Money Mortgage
Purchase Details
Closed on
Mar 24, 2010
Sold by
Hsbc Mortgage Svcs Llc
Bought by
Ls Home Enterprises Ll
Purchase Details
Closed on
Dec 21, 2009
Sold by
Maliar Lori J and Hsbc Mortgage Svcs
Bought by
Hsbc Mortgage Svcs Inc
Purchase Details
Closed on
Sep 23, 2003
Sold by
Catalano Concetta H
Bought by
Maliar Lori J
Create a Home Valuation Report for This Property
The Home Valuation Report is an in-depth analysis detailing your home's value as well as a comparison with similar homes in the area
Home Values in the Area
Average Home Value in this Area
Purchase History
| Date | Buyer | Sale Price | Title Company |
|---|---|---|---|
| Lobo Fatima T | $225,000 | None Available | |
| Reis Carolyn | -- | -- | |
| Knott-Twine Laura | $154,000 | -- | |
| Ls Home Enterprises Ll | $107,000 | -- | |
| Hsbc Mortgage Svcs Inc | $119,720 | -- | |
| Maliar Lori J | $122,000 | -- |
Source: Public Records
Mortgage History
| Date | Status | Borrower | Loan Amount |
|---|---|---|---|
| Previous Owner | Maliar Lori J | $80,000 | |
| Previous Owner | Maliar Lori J | $151,490 |
Source: Public Records
Tax History
| Year | Tax Paid | Tax Assessment Tax Assessment Total Assessment is a certain percentage of the fair market value that is determined by local assessors to be the total taxable value of land and additions on the property. | Land | Improvement |
|---|---|---|---|---|
| 2025 | $6,040 | $146,520 | $0 | $146,520 |
| 2024 | $3,787 | $87,630 | $0 | $87,630 |
| 2023 | $3,661 | $87,630 | $0 | $87,630 |
| 2022 | $3,600 | $87,630 | $0 | $87,630 |
| 2021 | $3,564 | $87,630 | $0 | $87,630 |
| 2020 | $3,566 | $87,630 | $0 | $87,630 |
| 2019 | $3,570 | $87,630 | $0 | $87,630 |
| 2018 | $3,854 | $94,500 | $0 | $94,500 |
| 2017 | $3,758 | $94,500 | $0 | $94,500 |
| 2016 | $3,642 | $94,500 | $0 | $94,500 |
| 2015 | $3,609 | $94,500 | $0 | $94,500 |
| 2014 | $3,472 | $94,500 | $0 | $94,500 |
Source: Public Records
Map
Nearby Homes
- 35 Stillwold Dr
- 108 Chamberlain Rd
- 147 Spring St
- 131 Coleman Rd
- 99 Maple St
- 1 Fernwood St
- 750 Wolcott Hill Rd
- 23 Hillcrest Ave
- 317-319 Garden St
- 31 Ox Yoke Dr
- 158 Dix Rd
- 38 Wheeler Rd
- 137 Dale Rd
- 192 Wolcott Hill Rd
- 250 Edward St
- 18 Avalon Place
- 493 Main St
- 11 Charter Rd
- 89 Merriman Rd
- 55 Rutledge Rd
- 16 Spring St Unit 40
- 16 Spring St Unit 11
- 31 Spring St
- 30 Spring St
- 29 Spring St
- 22 Spring St
- 20 Spring St
- 18 Spring St
- 17 Spring St
- 16 Spring St
- 14 Spring St
- 11 Spring St
- 9 Spring St
- 6 Spring St
- 5 Spring St
- 10 Wells Rd
- 16 Spring St Unit 34
- 16 Spring St Unit 23
- 16 Spring St Unit 2 bdrm
- 16 Spring St Unit 36
Your Personal Tour Guide
Ask me questions while you tour the home.