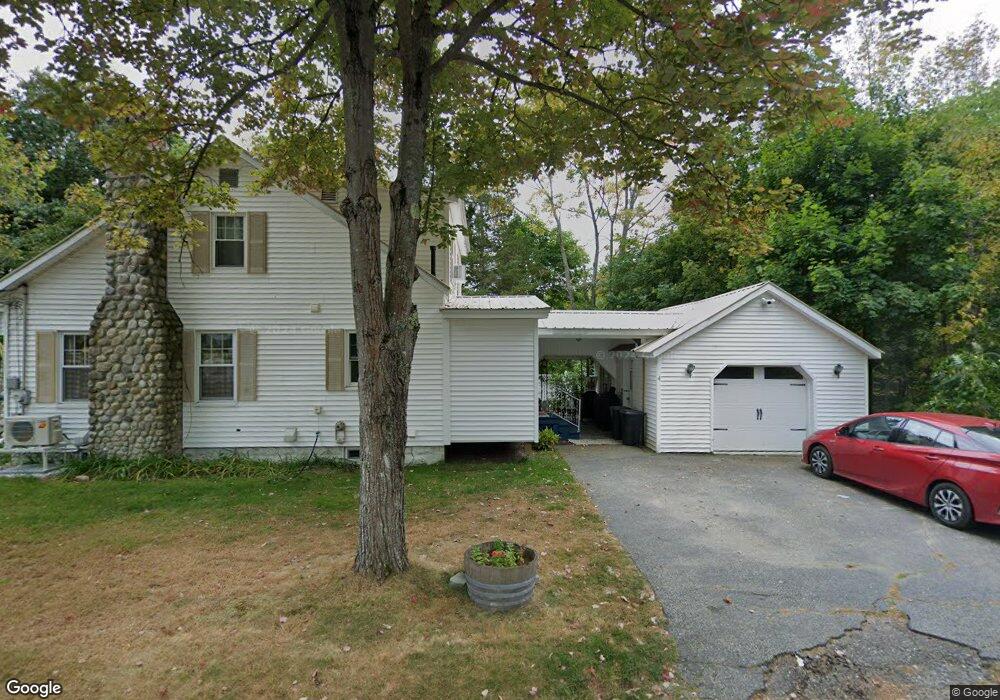
4 State St Lisbon Falls, ME 04252
Estimated Value: $313,000 - $339,904
3
Beds
1
Bath
1,078
Sq Ft
$304/Sq Ft
Est. Value
About This Home
This home is located at 4 State St, Lisbon Falls, ME 04252 and is currently estimated at $327,476, approximately $303 per square foot. 4 State St is a home with nearby schools including Lisbon Community School, Philip W. Sugg Middle School, and Lisbon High School.
Ownership History
Date
Name
Owned For
Owner Type
Purchase Details
Closed on
Mar 31, 2023
Sold by
Gayne Brittany M
Bought by
Vanpaepeghem Amy R and Vanpaepeghem Van Paepeghem
Current Estimated Value
Home Financials for this Owner
Home Financials are based on the most recent Mortgage that was taken out on this home.
Original Mortgage
$291,000
Outstanding Balance
$280,561
Interest Rate
6.32%
Mortgage Type
Purchase Money Mortgage
Estimated Equity
$46,915
Purchase Details
Closed on
Oct 2, 2018
Sold by
Strout Beatrice Anna Est and Strout
Bought by
Charette Brittany
Create a Home Valuation Report for This Property
The Home Valuation Report is an in-depth analysis detailing your home's value as well as a comparison with similar homes in the area
Home Values in the Area
Average Home Value in this Area
Purchase History
| Date | Buyer | Sale Price | Title Company |
|---|---|---|---|
| Vanpaepeghem Amy R | $300,000 | None Available | |
| Charette Brittany | -- | -- |
Source: Public Records
Mortgage History
| Date | Status | Borrower | Loan Amount |
|---|---|---|---|
| Open | Vanpaepeghem Amy R | $291,000 |
Source: Public Records
Tax History
| Year | Tax Paid | Tax Assessment Tax Assessment Total Assessment is a certain percentage of the fair market value that is determined by local assessors to be the total taxable value of land and additions on the property. | Land | Improvement |
|---|---|---|---|---|
| 2025 | $4,770 | $276,500 | $55,000 | $221,500 |
| 2024 | $3,766 | $276,900 | $55,000 | $221,900 |
| 2023 | $3,355 | $159,000 | $36,300 | $122,700 |
| 2022 | $3,673 | $159,000 | $36,300 | $122,700 |
| 2021 | $3,514 | $159,000 | $36,300 | $122,700 |
| 2020 | $3,673 | $159,000 | $36,300 | $122,700 |
| 2019 | $3,673 | $159,000 | $36,300 | $122,700 |
| 2018 | $3,423 | $137,800 | $31,600 | $106,200 |
| 2017 | $2,594 | $137,800 | $31,600 | $106,200 |
| 2016 | $2,616 | $137,800 | $31,600 | $106,200 |
| 2015 | $2,295 | $111,210 | $28,910 | $82,300 |
| 2014 | $2,378 | $111,210 | $28,910 | $82,300 |
| 2013 | -- | $111,210 | $28,910 | $82,300 |
Source: Public Records
Map
Nearby Homes
Your Personal Tour Guide
Ask me questions while you tour the home.