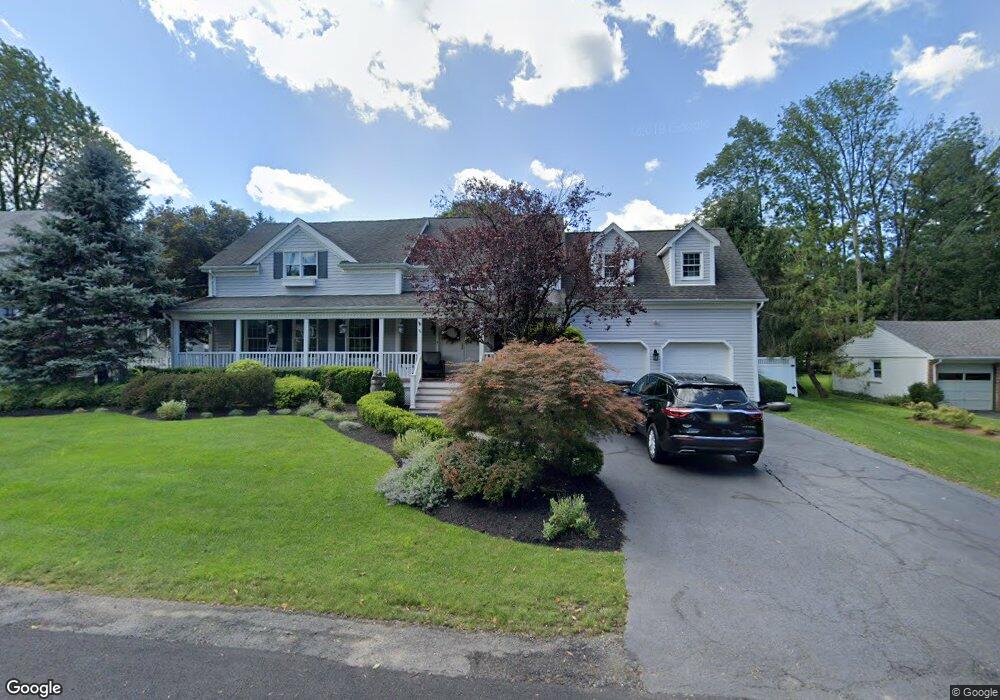
4 Sterling Ave Mendham, NJ 07945
Estimated Value: $943,276 - $1,142,000
Studio
--
Bath
3,009
Sq Ft
$350/Sq Ft
Est. Value
About This Home
This home is located at 4 Sterling Ave, Mendham, NJ 07945 and is currently estimated at $1,052,569, approximately $349 per square foot. 4 Sterling Ave is a home located in Morris County with nearby schools including Hilltop Elementary School, Mountain View Middle School, and West Morris Mendham High School.
Ownership History
Date
Name
Owned For
Owner Type
Purchase Details
Closed on
Dec 20, 1996
Sold by
Cacchio Robert and Cacchio Rocco
Bought by
Bruin Michael S and Bruin Barbara A
Current Estimated Value
Home Financials for this Owner
Home Financials are based on the most recent Mortgage that was taken out on this home.
Original Mortgage
$158,743
Outstanding Balance
$15,788
Interest Rate
7.46%
Mortgage Type
FHA
Estimated Equity
$1,036,781
Create a Home Valuation Report for This Property
The Home Valuation Report is an in-depth analysis detailing your home's value as well as a comparison with similar homes in the area
Home Values in the Area
Average Home Value in this Area
Purchase History
| Date | Buyer | Sale Price | Title Company |
|---|---|---|---|
| Bruin Michael S | $175,000 | -- |
Source: Public Records
Mortgage History
| Date | Status | Borrower | Loan Amount |
|---|---|---|---|
| Open | Bruin Michael S | $158,743 |
Source: Public Records
Tax History
| Year | Tax Paid | Tax Assessment Tax Assessment Total Assessment is a certain percentage of the fair market value that is determined by local assessors to be the total taxable value of land and additions on the property. | Land | Improvement |
|---|---|---|---|---|
| 2025 | $15,751 | $640,300 | $266,000 | $374,300 |
| 2024 | $15,713 | $640,300 | $266,000 | $374,300 |
Source: Public Records
Map
Nearby Homes
Your Personal Tour Guide
Ask me questions while you tour the home.