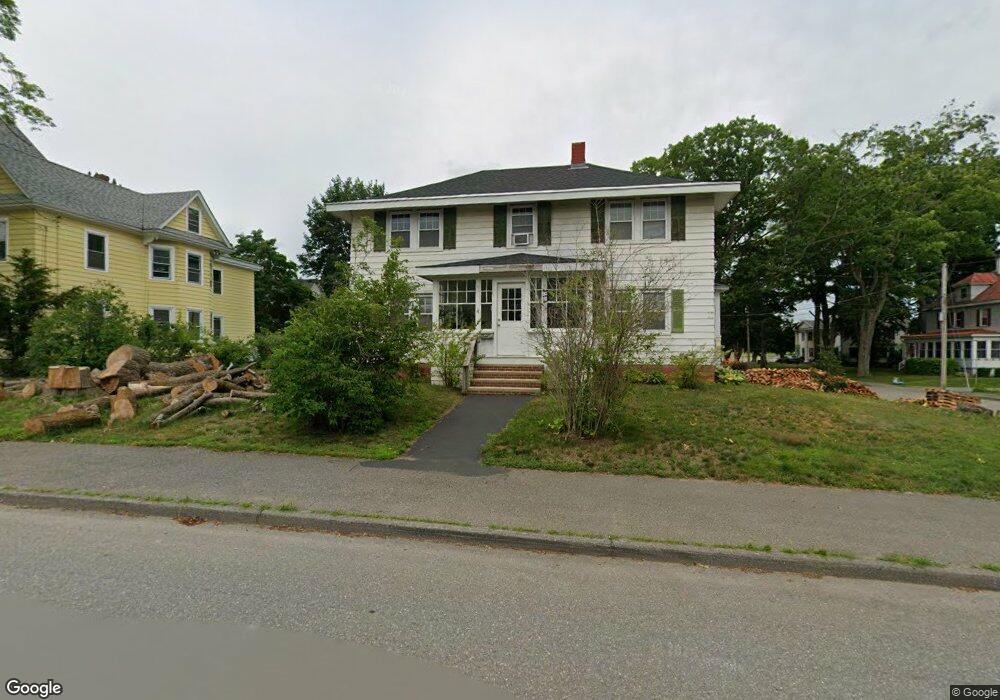
4 Stobie St Winslow, ME 04901
Estimated Value: $264,016 - $283,000
4
Beds
1
Bath
1,950
Sq Ft
$140/Sq Ft
Est. Value
About This Home
This home is located at 4 Stobie St, Winslow, ME 04901 and is currently estimated at $272,254, approximately $139 per square foot. 4 Stobie St is a home located in Kennebec County with nearby schools including Winslow Elementary School, Winslow Junior High School, and Winslow High School.
Ownership History
Date
Name
Owned For
Owner Type
Purchase Details
Closed on
Sep 5, 2006
Sold by
Kennebec River Dev Park
Bought by
Fritzberg Melissa and Fritzberg Jean
Current Estimated Value
Home Financials for this Owner
Home Financials are based on the most recent Mortgage that was taken out on this home.
Original Mortgage
$120,650
Outstanding Balance
$73,084
Interest Rate
6.83%
Mortgage Type
Purchase Money Mortgage
Estimated Equity
$199,170
Purchase Details
Closed on
May 16, 2005
Sold by
Kennebec River Dev Pk Llc
Bought by
Washburn April L
Home Financials for this Owner
Home Financials are based on the most recent Mortgage that was taken out on this home.
Original Mortgage
$87,200
Interest Rate
7%
Mortgage Type
Adjustable Rate Mortgage/ARM
Create a Home Valuation Report for This Property
The Home Valuation Report is an in-depth analysis detailing your home's value as well as a comparison with similar homes in the area
Home Values in the Area
Average Home Value in this Area
Purchase History
| Date | Buyer | Sale Price | Title Company |
|---|---|---|---|
| Fritzberg Melissa | -- | -- | |
| Fritzberg Melissa | $2,500 | -- | |
| Washburn April L | -- | -- | |
| Washburn April I | -- | -- |
Source: Public Records
Mortgage History
| Date | Status | Borrower | Loan Amount |
|---|---|---|---|
| Open | Fritzberg Melissa | $120,650 | |
| Previous Owner | Washburn April I | $87,200 | |
| Previous Owner | Washburn April I | $218,000 |
Source: Public Records
Tax History Compared to Growth
Tax History
| Year | Tax Paid | Tax Assessment Tax Assessment Total Assessment is a certain percentage of the fair market value that is determined by local assessors to be the total taxable value of land and additions on the property. | Land | Improvement |
|---|---|---|---|---|
| 2024 | $2,706 | $180,400 | $25,200 | $155,200 |
| 2023 | $2,706 | $180,400 | $25,200 | $155,200 |
| 2022 | $2,644 | $124,700 | $19,700 | $105,000 |
| 2021 | $2,519 | $124,700 | $19,700 | $105,000 |
| 2020 | $2,347 | $124,700 | $19,700 | $105,000 |
| 2019 | $2,324 | $124,700 | $19,700 | $105,000 |
| 2018 | $2,237 | $124,700 | $19,700 | $105,000 |
| 2017 | $2,087 | $124,700 | $19,700 | $105,000 |
| 2016 | $1,963 | $124,700 | $19,700 | $105,000 |
| 2015 | $1,933 | $124,700 | $19,700 | $105,000 |
| 2014 | $1,933 | $124,700 | $19,700 | $105,000 |
Source: Public Records
Map
Nearby Homes
- 16 Hallowell St
- 10 Leighton St
- 145-147 Main St
- 29 Bellevue St
- 1 Oakhill Terrace
- 11 Poulin St
- 13 Poulin St
- 11 College Ave
- 90 Elm St
- 5 2nd St
- 44 Silver St
- 29 Halifax St
- 30-32 Green St
- 73 Halifax St
- 85 Halifax St
- 21 Cardinal Way
- 158 Clinton Ave
- 50 Pleasant St Unit 4
- 50 Pleasant St Unit 8
- 18 Western Ave