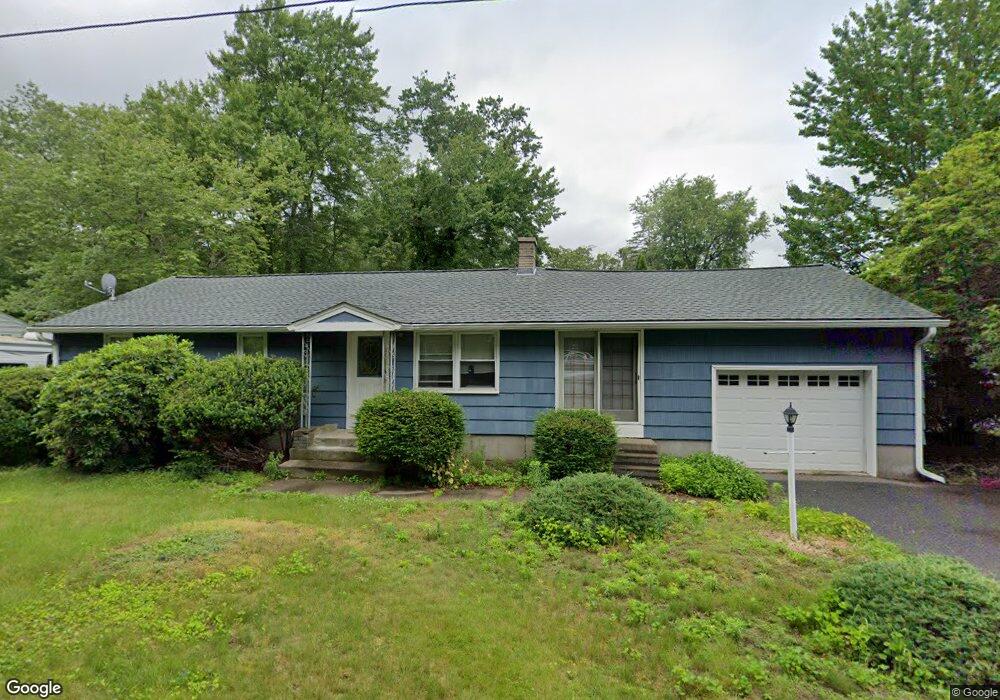
4 Stone St Auburn, MA 01501
Pondville NeighborhoodEstimated Value: $422,211 - $496,000
4
Beds
1
Bath
1,600
Sq Ft
$290/Sq Ft
Est. Value
About This Home
This home is located at 4 Stone St, Auburn, MA 01501 and is currently estimated at $464,303, approximately $290 per square foot. 4 Stone St is a home located in Worcester County with nearby schools including Auburn Senior High School and Shrewsbury Montessori School - Auburn Campus.
Ownership History
Date
Name
Owned For
Owner Type
Purchase Details
Closed on
Nov 29, 2004
Sold by
Giorgio Diana H
Bought by
Greiner Bryan J
Current Estimated Value
Home Financials for this Owner
Home Financials are based on the most recent Mortgage that was taken out on this home.
Original Mortgage
$209,600
Outstanding Balance
$105,108
Interest Rate
5.75%
Mortgage Type
Purchase Money Mortgage
Estimated Equity
$359,195
Purchase Details
Closed on
Aug 21, 1998
Sold by
Burda Rose L
Bought by
Giorgio Diana H
Create a Home Valuation Report for This Property
The Home Valuation Report is an in-depth analysis detailing your home's value as well as a comparison with similar homes in the area
Home Values in the Area
Average Home Value in this Area
Purchase History
| Date | Buyer | Sale Price | Title Company |
|---|---|---|---|
| Greiner Bryan J | $262,000 | -- | |
| Giorgio Diana H | $89,900 | -- |
Source: Public Records
Mortgage History
| Date | Status | Borrower | Loan Amount |
|---|---|---|---|
| Open | Greiner Bryan J | $209,600 | |
| Previous Owner | Giorgio Diana H | $208,000 | |
| Previous Owner | Giorgio Diana H | $70,500 | |
| Previous Owner | Giorgio Diana H | $48,000 |
Source: Public Records
Tax History
| Year | Tax Paid | Tax Assessment Tax Assessment Total Assessment is a certain percentage of the fair market value that is determined by local assessors to be the total taxable value of land and additions on the property. | Land | Improvement |
|---|---|---|---|---|
| 2025 | $48 | $334,500 | $114,300 | $220,200 |
| 2024 | $5,112 | $342,400 | $108,600 | $233,800 |
| 2023 | $4,923 | $310,000 | $98,700 | $211,300 |
| 2022 | $4,594 | $273,100 | $98,700 | $174,400 |
| 2021 | $4,421 | $243,700 | $87,100 | $156,600 |
| 2020 | $10,914 | $243,700 | $87,100 | $156,600 |
| 2019 | $4,060 | $220,400 | $86,200 | $134,200 |
| 2018 | $3,683 | $217,000 | $80,600 | $136,400 |
| 2017 | $3,842 | $209,500 | $73,100 | $136,400 |
| 2016 | $3,692 | $204,100 | $76,900 | $127,200 |
| 2015 | $3,336 | $193,300 | $76,900 | $116,400 |
| 2014 | $3,138 | $181,500 | $73,100 | $108,400 |
Source: Public Records
Map
Nearby Homes
- 61 School St
- 6 George St
- 751 Washington St Unit 43A
- 2 Victoria Dr Unit 1
- 634 Oxford St S
- 381 Oxford St N
- 31 Walsh Ave
- 31-33 Walsh Ave
- 33 Walsh Ave
- 303 W Main St
- 35 Waterman Rd
- 501 Forest Park Dr Unit 501
- 40 Bryn Mawr Ave
- 49 Prospect St
- 6 Buron Terrace
- 2 Breezy Bend
- 808 Washington St
- 19-20 Williams St
- 0 Athens St
- 0 Auburn Rd
Your Personal Tour Guide
Ask me questions while you tour the home.