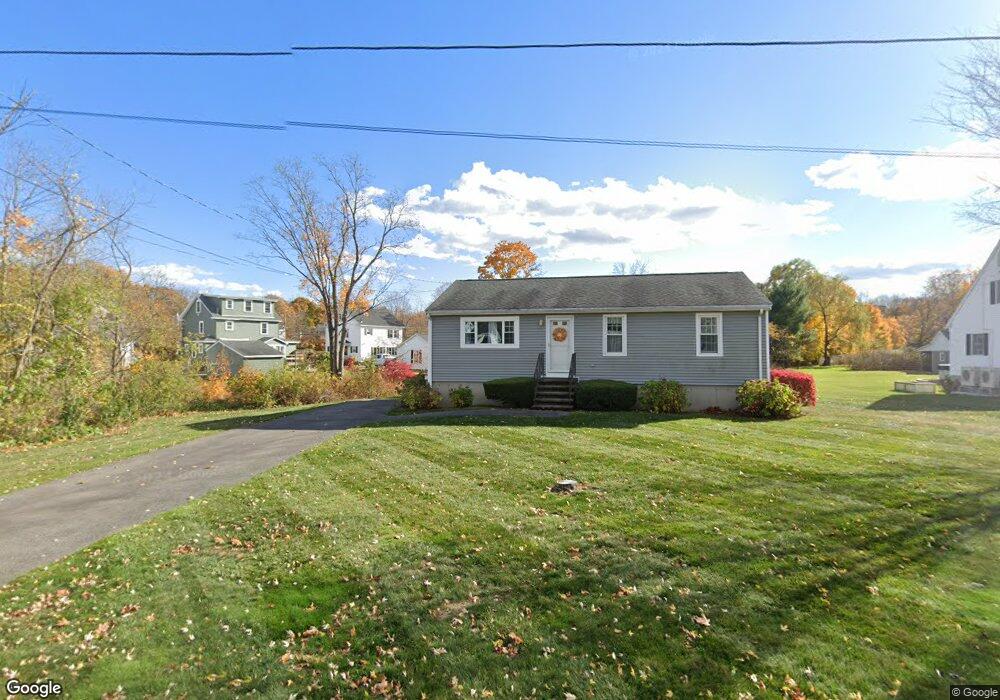
4 Stuart St Amesbury, MA 01913
Estimated Value: $494,000 - $542,958
1
Bed
1
Bath
960
Sq Ft
$545/Sq Ft
Est. Value
About This Home
This home is located at 4 Stuart St, Amesbury, MA 01913 and is currently estimated at $523,490, approximately $545 per square foot. 4 Stuart St is a home located in Essex County with nearby schools including Amesbury High School and Amesbury Seventh-Day Adventist School.
Ownership History
Date
Name
Owned For
Owner Type
Purchase Details
Closed on
Sep 9, 2009
Sold by
Senter Ronald F and Senter Mary Ellen
Bought by
Senter Mary Ellen
Current Estimated Value
Home Financials for this Owner
Home Financials are based on the most recent Mortgage that was taken out on this home.
Original Mortgage
$160,000
Outstanding Balance
$105,539
Interest Rate
5.36%
Estimated Equity
$417,951
Purchase Details
Closed on
Jan 14, 1991
Sold by
Marcy Rt
Bought by
Senter Ronald F
Create a Home Valuation Report for This Property
The Home Valuation Report is an in-depth analysis detailing your home's value as well as a comparison with similar homes in the area
Home Values in the Area
Average Home Value in this Area
Purchase History
| Date | Buyer | Sale Price | Title Company |
|---|---|---|---|
| Senter Mary Ellen | -- | -- | |
| Senter Ronald F | $109,500 | -- |
Source: Public Records
Mortgage History
| Date | Status | Borrower | Loan Amount |
|---|---|---|---|
| Open | Senter Ronald F | $160,000 | |
| Previous Owner | Senter Ronald F | $15,000 | |
| Previous Owner | Senter Ronald F | $95,000 | |
| Previous Owner | Senter Ronald F | $10,000 |
Source: Public Records
Tax History
| Year | Tax Paid | Tax Assessment Tax Assessment Total Assessment is a certain percentage of the fair market value that is determined by local assessors to be the total taxable value of land and additions on the property. | Land | Improvement |
|---|---|---|---|---|
| 2025 | $7,396 | $483,400 | $231,200 | $252,200 |
| 2024 | $6,977 | $446,100 | $218,100 | $228,000 |
| 2023 | $6,824 | $417,600 | $189,600 | $228,000 |
| 2022 | $6,597 | $372,900 | $164,900 | $208,000 |
| 2021 | $6,057 | $331,900 | $127,500 | $204,400 |
| 2020 | $5,367 | $312,400 | $122,600 | $189,800 |
| 2019 | $5,300 | $288,500 | $122,600 | $165,900 |
| 2018 | $5,443 | $286,600 | $116,700 | $169,900 |
| 2017 | $5,081 | $254,700 | $116,700 | $138,000 |
| 2016 | $5,017 | $247,400 | $116,700 | $130,700 |
| 2015 | $4,856 | $236,400 | $116,700 | $119,700 |
| 2014 | $4,408 | $210,200 | $116,700 | $93,500 |
Source: Public Records
Map
Nearby Homes
- 149 Market St
- 105 Market St Unit B
- 101 Market St Unit B
- 1 Brown Ave Unit 1-25
- 25 Cedar St Unit 4
- 3 Tremont Ave Unit A
- 48 Orchard St
- 97 Elm St
- 4 Clark St
- 25 Whittier Meadows Dr
- 21 Congress St
- 21 River St
- 1 Hillside Ave Unit 3
- 4 Greenwood St
- 9 Elmwood St
- 14 Mason Ct Unit 14
- 20 Mason Ct
- 82 Monroe St
- 253 Main St
- 382 Main St
Your Personal Tour Guide
Ask me questions while you tour the home.