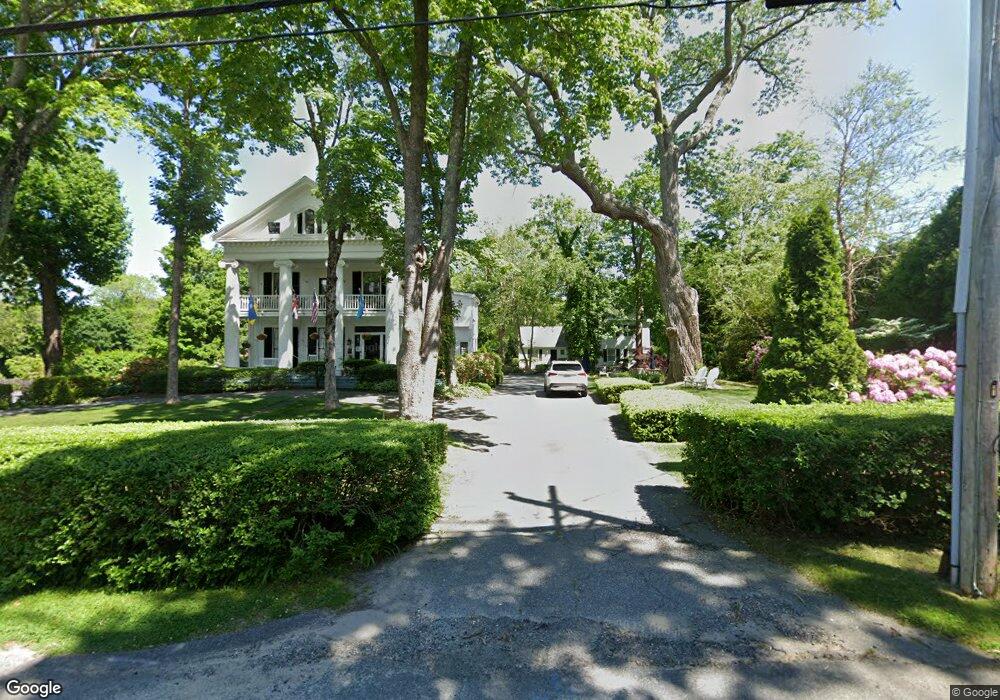
4 Summer St Yarmouth Port, MA 2675
Yarmouth Port NeighborhoodEstimated Value: $2,785,930
3
Beds
2
Baths
7,767
Sq Ft
$359/Sq Ft
Est. Value
About This Home
This home is located at 4 Summer St, Yarmouth Port, MA 2675 and is currently estimated at $2,785,930, approximately $358 per square foot. 4 Summer St is a home located in Barnstable County with nearby schools including Dennis-Yarmouth Regional High School, Trinity Christian Academy of Cape Cod, and St. Pius X. School.
Ownership History
Date
Name
Owned For
Owner Type
Purchase Details
Closed on
Oct 10, 2006
Sold by
Swift Elisa M and Prunty Sean K
Bought by
Inn At Cape Cod Llc
Current Estimated Value
Home Financials for this Owner
Home Financials are based on the most recent Mortgage that was taken out on this home.
Original Mortgage
$625,000
Outstanding Balance
$370,735
Interest Rate
6.54%
Mortgage Type
Commercial
Estimated Equity
$2,415,195
Purchase Details
Closed on
Mar 26, 2004
Sold by
Heywood Douglas Weld and Billingham William G
Bought by
Swift Elisa M and Prunty Sean K
Purchase Details
Closed on
May 12, 1999
Sold by
Malloy Lee and Malloy Diana
Bought by
12 Mctaggart St Nt
Home Financials for this Owner
Home Financials are based on the most recent Mortgage that was taken out on this home.
Original Mortgage
$440,000
Interest Rate
6.92%
Mortgage Type
Commercial
Purchase Details
Closed on
May 6, 1996
Sold by
Wcf Realty Corp
Bought by
Malloy Lee and Malloy Diana
Purchase Details
Closed on
May 9, 1988
Sold by
T J Realty Tr
Bought by
Vancisin Kenneth
Create a Home Valuation Report for This Property
The Home Valuation Report is an in-depth analysis detailing your home's value as well as a comparison with similar homes in the area
Home Values in the Area
Average Home Value in this Area
Purchase History
| Date | Buyer | Sale Price | Title Company |
|---|---|---|---|
| Inn At Cape Cod Llc | $1,410,000 | -- | |
| Inn At Cape Cod Llc | $1,410,000 | -- | |
| Swift Elisa M | $1,150,000 | -- | |
| Swift Elisa M | $1,150,000 | -- | |
| 12 Mctaggart St Nt | $639,000 | -- | |
| 12 Mctaggart St Nt | $639,000 | -- | |
| Malloy Lee | $380,000 | -- | |
| Malloy Lee | $380,000 | -- | |
| Vancisin Kenneth | $700,000 | -- |
Source: Public Records
Mortgage History
| Date | Status | Borrower | Loan Amount |
|---|---|---|---|
| Open | Inn At Cape Cod Llc | $625,000 | |
| Closed | Vancisin Kenneth | $625,000 | |
| Previous Owner | Vancisin Kenneth | $54,300 | |
| Previous Owner | Vancisin Kenneth | $440,000 |
Source: Public Records
Tax History Compared to Growth
Tax History
| Year | Tax Paid | Tax Assessment Tax Assessment Total Assessment is a certain percentage of the fair market value that is determined by local assessors to be the total taxable value of land and additions on the property. | Land | Improvement |
|---|---|---|---|---|
| 2025 | $11,831 | $1,671,000 | $344,500 | $1,326,500 |
| 2024 | $11,649 | $1,578,400 | $300,600 | $1,277,800 |
| 2023 | $12,447 | $1,534,800 | $254,200 | $1,280,600 |
| 2022 | $11,889 | $1,295,100 | $228,700 | $1,066,400 |
| 2021 | $11,297 | $1,181,700 | $214,800 | $966,900 |
| 2020 | $3,381 | $1,172,200 | $207,600 | $964,600 |
| 2019 | $11,380 | $1,126,700 | $207,600 | $919,100 |
| 2018 | $3,100 | $1,116,300 | $197,200 | $919,100 |
| 2017 | $11,185 | $1,116,300 | $197,200 | $919,100 |
| 2016 | $11,141 | $1,116,300 | $197,200 | $919,100 |
| 2015 | $10,470 | $1,042,800 | $197,200 | $845,600 |
Source: Public Records
Map
Nearby Homes
- 186 Route 6a
- 162 Route 6a
- 116 Main St
- 116 Main (Route 6a) St
- 112 Main St
- 56 Wharf Ln
- 371 Route 6a
- 105 Old Hyannis Rd
- 25 Congressional Dr
- 4390 Main St
- 933-935 W Yarmouth Rd
- 33 Midpine Rd
- 882 W Yarmouth Rd
- 81 Desert Sands Ln
- 99 Old Hyannis Rd
- 23 Dauphine Dr
- 10 Balsam Way
- 24 Minnetuxet Way
- 111 Old Hyannis Rd
- 50 Cottonwood St