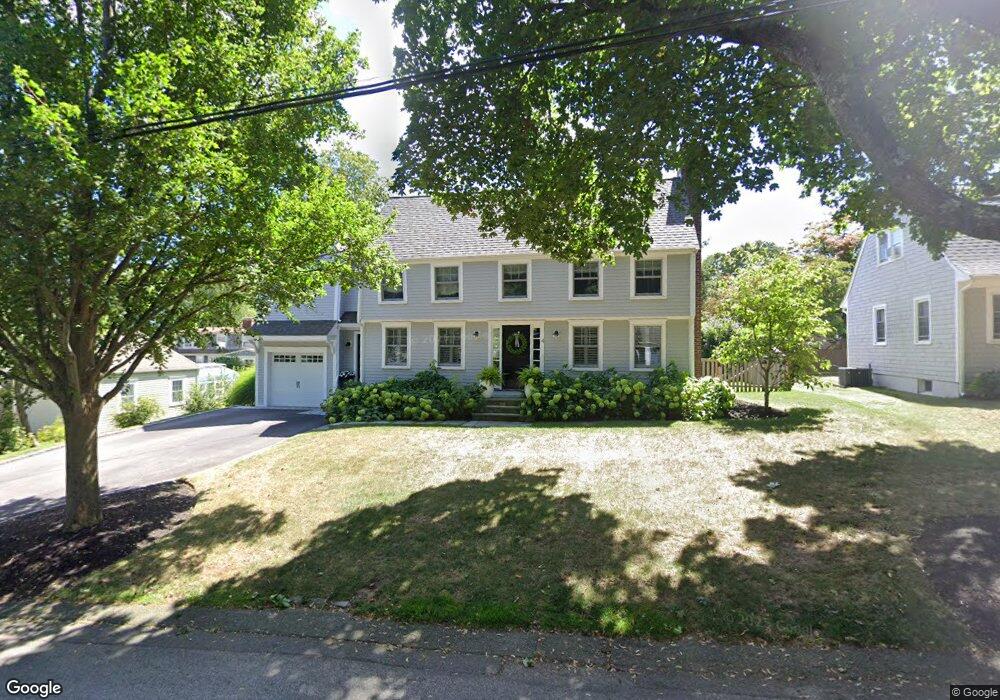
4 Summit Dr Hingham, MA 02043
Estimated Value: $1,113,000 - $1,397,000
3
Beds
3
Baths
1,900
Sq Ft
$664/Sq Ft
Est. Value
About This Home
This home is located at 4 Summit Dr, Hingham, MA 02043 and is currently estimated at $1,261,425, approximately $663 per square foot. 4 Summit Dr is a home located in Plymouth County with nearby schools including William L. Foster Elementary School, Hingham Middle School, and Hingham High School.
Ownership History
Date
Name
Owned For
Owner Type
Purchase Details
Closed on
Dec 6, 2023
Sold by
Duncan Jason G and Duncan Adrien C
Bought by
Jason G Duncan Ret and Duncan
Current Estimated Value
Purchase Details
Closed on
Jul 14, 2009
Sold by
Bienstock Evan M and Serafin Olivia R
Bought by
Duncan Jason G and Duncan Adrien C
Purchase Details
Closed on
Apr 29, 2005
Sold by
Ross Peter L and Ross Marcia G
Bought by
Bienstock Evan M and Serafin Olivia R
Purchase Details
Closed on
Nov 15, 1994
Sold by
Leary Stephen R and Leary Maryann W
Bought by
Ross Peter L and Ross Marcia G
Create a Home Valuation Report for This Property
The Home Valuation Report is an in-depth analysis detailing your home's value as well as a comparison with similar homes in the area
Purchase History
| Date | Buyer | Sale Price | Title Company |
|---|---|---|---|
| Jason G Duncan Ret | -- | None Available | |
| Duncan Jason G | $690,000 | -- | |
| Bienstock Evan M | $630,000 | -- | |
| Ross Peter L | $253,000 | -- | |
| Ross Peter L | $253,000 | -- |
Source: Public Records
Mortgage History
| Date | Status | Borrower | Loan Amount |
|---|---|---|---|
| Previous Owner | Ross Peter L | $523,750 | |
| Previous Owner | Ross Peter L | $523,000 |
Source: Public Records
Tax History Compared to Growth
Tax History
| Year | Tax Paid | Tax Assessment Tax Assessment Total Assessment is a certain percentage of the fair market value that is determined by local assessors to be the total taxable value of land and additions on the property. | Land | Improvement |
|---|---|---|---|---|
| 2025 | $10,513 | $983,400 | $515,100 | $468,300 |
| 2024 | $10,234 | $943,200 | $515,100 | $428,100 |
| 2023 | $9,264 | $926,400 | $515,100 | $411,300 |
| 2022 | $8,492 | $734,600 | $429,300 | $305,300 |
| 2021 | $8,573 | $726,500 | $447,200 | $279,300 |
| 2020 | $8,377 | $726,500 | $447,200 | $279,300 |
| 2019 | $5,548 | $709,100 | $447,200 | $261,900 |
| 2018 | $8,346 | $709,100 | $447,200 | $261,900 |
| 2017 | $5,065 | $669,000 | $421,000 | $248,000 |
| 2016 | $7,348 | $588,300 | $320,800 | $267,500 |
| 2015 | $7,180 | $573,000 | $305,500 | $267,500 |
Source: Public Records
Map
Nearby Homes
- 225 South St Unit 1
- 246 North St
- 191 South St
- 18 West St
- 132 Hms Stayner Dr Unit 132
- 21 Hersey St
- 125 Halsted Dr Unit 125
- 12 Daley Rd
- 19 Lantern Ln
- 16 Beal's Cove Rd Unit E
- 53 Bel Air Rd - To Be Built
- 83 North St
- 16 Foley Beach Rd
- 17 Paige St
- 15 Lewis Ct
- 81 Kimball Beach Rd
- 7 Lewis Ct
- 130 Broad Reach Unit 206
- 73 Broad Reach Unit M36C
- 73 Broad Reach Unit M21C