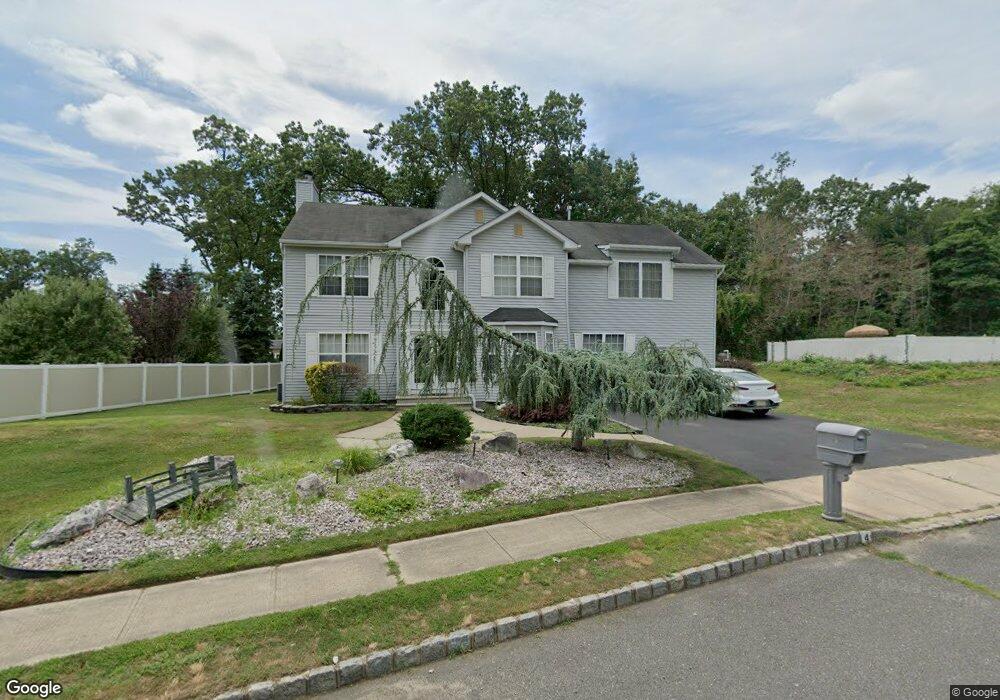
4 Sun Hollow Rd Howell, NJ 07731
Salem Hill NeighborhoodEstimated Value: $823,000 - $896,000
4
Beds
2
Baths
2,720
Sq Ft
$319/Sq Ft
Est. Value
About This Home
This home is located at 4 Sun Hollow Rd, Howell, NJ 07731 and is currently estimated at $866,949, approximately $318 per square foot. 4 Sun Hollow Rd is a home located in Monmouth County with nearby schools including Land O' Pines School, Newbury School, and Howell Middle School North.
Ownership History
Date
Name
Owned For
Owner Type
Purchase Details
Closed on
Jun 13, 2008
Sold by
Safatle Albert K and Safatle Judith
Bought by
Comer Robert A and Comer Denise
Current Estimated Value
Home Financials for this Owner
Home Financials are based on the most recent Mortgage that was taken out on this home.
Original Mortgage
$384,000
Outstanding Balance
$246,663
Interest Rate
6.07%
Mortgage Type
Purchase Money Mortgage
Estimated Equity
$620,286
Purchase Details
Closed on
Oct 9, 1996
Sold by
M R C At Howell
Bought by
Safatle Albert and Safatle Judith
Home Financials for this Owner
Home Financials are based on the most recent Mortgage that was taken out on this home.
Original Mortgage
$148,000
Interest Rate
8.26%
Create a Home Valuation Report for This Property
The Home Valuation Report is an in-depth analysis detailing your home's value as well as a comparison with similar homes in the area
Home Values in the Area
Average Home Value in this Area
Purchase History
| Date | Buyer | Sale Price | Title Company |
|---|---|---|---|
| Comer Robert A | $480,000 | Fidelity Natl Title Ins Co | |
| Safatle Albert | $184,900 | -- |
Source: Public Records
Mortgage History
| Date | Status | Borrower | Loan Amount |
|---|---|---|---|
| Open | Comer Robert A | $384,000 | |
| Previous Owner | Safatle Albert | $148,000 |
Source: Public Records
Tax History Compared to Growth
Tax History
| Year | Tax Paid | Tax Assessment Tax Assessment Total Assessment is a certain percentage of the fair market value that is determined by local assessors to be the total taxable value of land and additions on the property. | Land | Improvement |
|---|---|---|---|---|
| 2025 | $12,418 | $755,100 | $390,000 | $365,100 |
| 2024 | $12,190 | $698,400 | $340,000 | $358,400 |
| 2023 | $12,190 | $655,000 | $305,000 | $350,000 |
| 2022 | $10,169 | $569,100 | $210,000 | $359,100 |
| 2021 | $10,169 | $469,400 | $150,000 | $319,400 |
| 2020 | $10,793 | $464,800 | $150,000 | $314,800 |
| 2019 | $10,869 | $459,400 | $150,000 | $309,400 |
| 2018 | $10,834 | $455,000 | $160,000 | $295,000 |
| 2017 | $10,824 | $449,500 | $160,000 | $289,500 |
| 2016 | $10,754 | $442,200 | $160,000 | $282,200 |
| 2015 | $10,273 | $418,100 | $140,000 | $278,100 |
| 2014 | $10,232 | $386,400 | $155,000 | $231,400 |
Source: Public Records
Map
Nearby Homes
- 43 Darien Rd
- 1 Sun Hollow Rd
- 53 Darien Rd
- 52 Darien Rd
- 3 Diamond Ln
- 24 Sun Hollow Rd
- 254 Aldrich Rd
- 22 Diamond Ln
- 21 Christopher Dr
- 4 Rainbow Dr
- 66 Diamond Ln
- 324 Aldrich Rd
- 2 Lyndon Ln
- 4 Christopher Dr
- 44 Diamond Ln
- 9 Yellowstone Ln
- 0 Windeler Rd Unit 22523932
- 47 Yellowstone Ln
- 131 Starlight Rd
- 7 Cherry Bend Dr