Estimated Value: $523,000 - $699,000
Studio
--
Bath
1,434
Sq Ft
$426/Sq Ft
Est. Value
About This Home
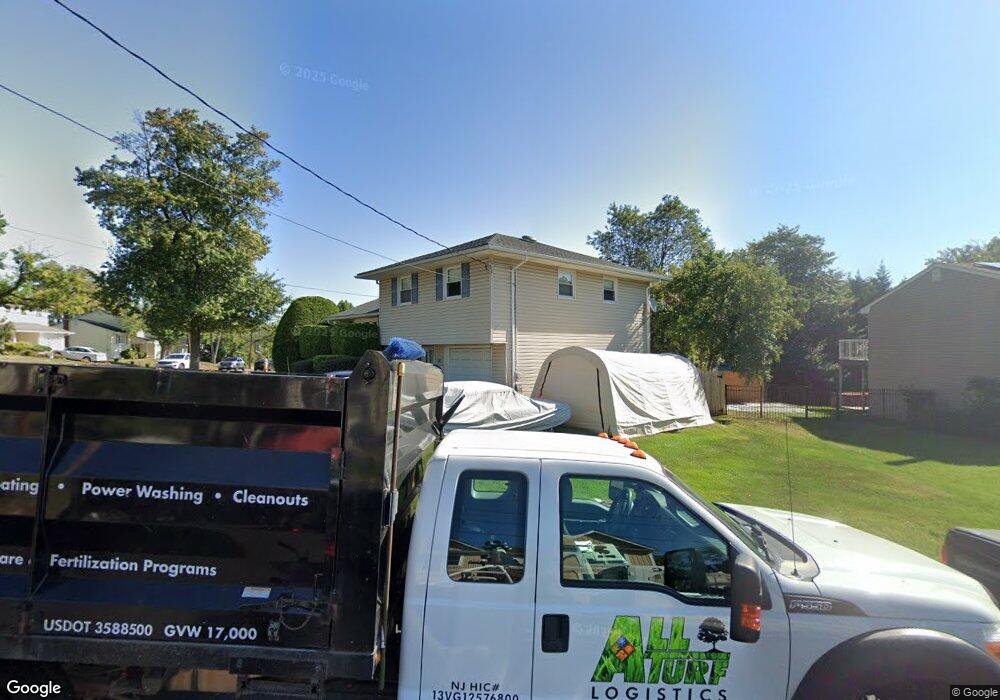
This home is located at 4 Sycamore Rd, Clark, NJ 07066 and is currently estimated at $610,525, approximately $425 per square foot. 4 Sycamore Rd is a home located in Union County with nearby schools including Valley Road Elementary School, Carl H. Kumpf Middle School, and Arthur L. Johnson High School.
Ownership History
Date
Name
Owned For
Owner Type
Purchase Details
Closed on
Aug 12, 2018
Sold by
Fleckenstein John and Fleckenstein Melissa
Bought by
Fleckenstein Melissa
Current Estimated Value
Purchase Details
Closed on
Aug 9, 2001
Sold by
Burakof Howard and Burakof Judith
Bought by
Fleckenstein John and Fleckenstein Melissa
Home Financials for this Owner
Home Financials are based on the most recent Mortgage that was taken out on this home.
Original Mortgage
$40,450
Interest Rate
6.6%
Mortgage Type
Unknown
Create a Home Valuation Report for This Property
The Home Valuation Report is an in-depth analysis detailing your home's value as well as a comparison with similar homes in the area
Home Values in the Area
Average Home Value in this Area
Purchase History
| Date | Buyer | Sale Price | Title Company |
|---|---|---|---|
| Fleckenstein Melissa | $129,903 | None Available | |
| Fleckenstein John | $270,000 | -- |
Source: Public Records
Mortgage History
| Date | Status | Borrower | Loan Amount |
|---|---|---|---|
| Previous Owner | Fleckenstein John | $40,450 | |
| Previous Owner | Fleckenstein John | $216,000 |
Source: Public Records
Tax History
| Year | Tax Paid | Tax Assessment Tax Assessment Total Assessment is a certain percentage of the fair market value that is determined by local assessors to be the total taxable value of land and additions on the property. | Land | Improvement |
|---|---|---|---|---|
| 2025 | $9,212 | $416,100 | $232,600 | $183,500 |
| 2024 | $9,075 | $416,100 | $232,600 | $183,500 |
| 2023 | $9,075 | $416,100 | $232,600 | $183,500 |
| 2022 | $8,813 | $416,100 | $232,600 | $183,500 |
| 2021 | $9,681 | $108,900 | $40,000 | $68,900 |
| 2020 | $9,523 | $108,900 | $40,000 | $68,900 |
| 2019 | $9,427 | $108,900 | $40,000 | $68,900 |
| 2018 | $9,314 | $108,900 | $40,000 | $68,900 |
| 2017 | $9,165 | $108,900 | $40,000 | $68,900 |
| 2016 | $8,827 | $108,900 | $40,000 | $68,900 |
| 2015 | $8,738 | $108,900 | $40,000 | $68,900 |
| 2014 | $8,554 | $108,900 | $40,000 | $68,900 |
Source: Public Records
Map
Nearby Homes
- 205 West Ln
- 331 West Ln
- 275 Valley Rd
- 262 Valley Rd
- 910 Apgar Terrace
- 85 Fulton St
- 66 Lincoln Blvd
- 875 Rayhon Terrace
- 44 Joseph St
- 52 Broadway
- 1105 Georgian Dr
- 883 Stacy Place
- 2231 Winfield St
- 1472 Jefferson Ave
- 1190 W Saint Georges Ave Unit A 45
- 1015 Georgian Dr
- 1200 W Saint Georges Ave
- 651 W Lincoln Ave
- 707 Union St
- 1206 Westfield Ave
Your Personal Tour Guide
Ask me questions while you tour the home.