Estimated Value: $218,000 - $271,000
--
Bed
--
Bath
1,404
Sq Ft
$169/Sq Ft
Est. Value
About This Home
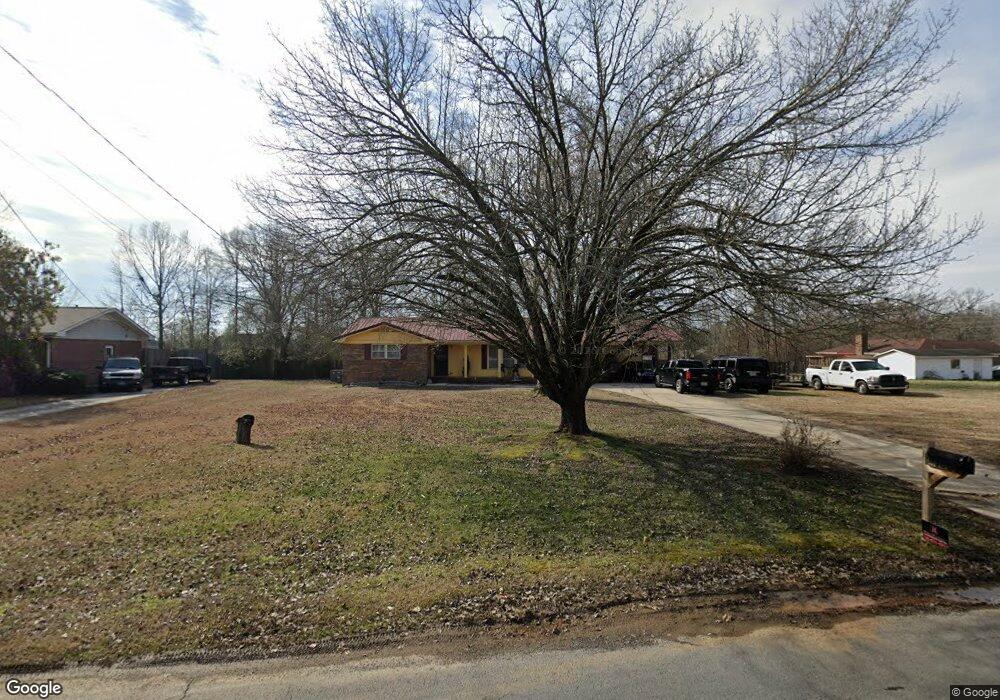
This home is located at 4 Sylvan Rd NE, Rome, GA 30165 and is currently estimated at $236,706, approximately $168 per square foot. 4 Sylvan Rd NE is a home located in Floyd County with nearby schools including Armuchee Middle School and Armuchee High School.
Ownership History
Date
Name
Owned For
Owner Type
Purchase Details
Closed on
Mar 23, 2012
Sold by
Wilson Donna Sue
Bought by
Aldridge Ralph Edward
Current Estimated Value
Purchase Details
Closed on
Mar 22, 2012
Sold by
Aldridge Ralph D
Bought by
Aldride Ralph Edward and Wilson Donna S
Purchase Details
Closed on
Jun 14, 2002
Sold by
Dorothy Brownlow J and Dorothy Brownlow
Bought by
Aldridge Ralph D and Aldridge Sue A
Purchase Details
Closed on
Oct 12, 1984
Sold by
Dyer Paul N and Dyer Doris K
Bought by
Dorothy Brownlow J and Dorothy Brownlow
Purchase Details
Closed on
Sep 24, 1976
Sold by
Miller Harry R
Bought by
Dyer Paul N and Dyer Doris K
Purchase Details
Closed on
Mar 8, 1974
Sold by
White Mrs Helen F
Bought by
Miller Harry R
Purchase Details
Closed on
Aug 30, 1965
Sold by
Headrick A W
Bought by
White Mrs Helen F
Purchase Details
Closed on
Jan 1, 1962
Bought by
Sylvan Acres Inc
Create a Home Valuation Report for This Property
The Home Valuation Report is an in-depth analysis detailing your home's value as well as a comparison with similar homes in the area
Home Values in the Area
Average Home Value in this Area
Purchase History
| Date | Buyer | Sale Price | Title Company |
|---|---|---|---|
| Aldridge Ralph Edward | $20,000 | -- | |
| Aldridge Ralph Edward | $20,000 | -- | |
| Aldride Ralph Edward | -- | -- | |
| Aldridge Ralph D | $93,000 | -- | |
| Dorothy Brownlow J | $44,000 | -- | |
| Dyer Paul N | $29,600 | -- | |
| Miller Harry R | $26,100 | -- | |
| White Mrs Helen F | -- | -- | |
| Headrick A W | $14,700 | -- | |
| Sylvan Acres Inc | -- | -- |
Source: Public Records
Tax History Compared to Growth
Tax History
| Year | Tax Paid | Tax Assessment Tax Assessment Total Assessment is a certain percentage of the fair market value that is determined by local assessors to be the total taxable value of land and additions on the property. | Land | Improvement |
|---|---|---|---|---|
| 2024 | $2,253 | $74,218 | $14,386 | $59,832 |
| 2023 | $2,173 | $70,463 | $12,947 | $57,516 |
| 2022 | $1,800 | $58,962 | $10,550 | $48,412 |
| 2021 | $1,565 | $50,213 | $9,590 | $40,623 |
| 2020 | $1,354 | $42,950 | $7,193 | $35,757 |
| 2019 | $1,236 | $39,700 | $7,193 | $32,507 |
| 2018 | $1,143 | $36,601 | $7,193 | $29,408 |
| 2017 | $937 | $29,677 | $7,193 | $22,484 |
| 2016 | $984 | $30,853 | $7,160 | $23,693 |
| 2015 | -- | $30,853 | $7,160 | $23,693 |
| 2014 | -- | $30,853 | $7,160 | $23,693 |
Source: Public Records
Map
Nearby Homes
- 23 Whistling Oaks Dr NE
- 9 Royal Oak Dr NE
- 3 Harbour Rd NE
- 12 Majestic Oaks Way NE
- 22 Mossy Oaks Ln NE
- 8 Mossy Oaks Ln NE
- 25 Majestic Oaks Way NE
- 17 Royal Oak Dr NE
- 42 Pippin Place NE
- 65 Tency Ln NE
- 12 Applewood Dr NE
- 10 Oak View Dr NE
- 31 Tency Ln NE
- 20 Pippin Place NE
- The Pearson Plan at Southbend
- The Harrington Plan at Southbend
- The Landen Plan at Southbend
- The Benson II Plan at Southbend
- The Caldwell Plan at Southbend
- The Bradley Plan at Southbend
- 6 Sylvan Rd NE
- 0 Sylvan Rd NE Unit 8464079
- 0 Sylvan Rd NE Unit 3045845
- 0 Sylvan Rd NE
- 1072 Old Dalton Rd NE
- 17 Whistling Oaks Way
- 19 Whistling Oaks Way
- 21 Whistling Oaks Way
- 1058 Old Dalton Rd NE
- 3 Whistling Oaks Dr NE
- 11 Spanish Oaks Trail NE
- 8 Sylvan Rd NE
- 5 Whistling Oaks Dr NE Unit 165
- 5 Whistling Oaks Dr NE
- 3 Sylvan Rd NE
- 0 Pine River Rd NE Unit 8248552
- 0 Pine River Rd NE
- 0 Pine River Rd NE Unit 10229300
- 0 Pine River Rd NE Unit 7308055
- 0 Pine River Rd NE Unit 20145246