4 Sylvan Rd Sharon, MA 02067
Estimated Value: $778,400 - $942,000
3
Beds
2
Baths
1,766
Sq Ft
$477/Sq Ft
Est. Value
About This Home
This home is located at 4 Sylvan Rd, Sharon, MA 02067 and is currently estimated at $841,600, approximately $476 per square foot. 4 Sylvan Rd is a home located in Norfolk County with nearby schools including Cottage Street Elementary School, Sharon Middle School, and Sharon High School.
Ownership History
Date
Name
Owned For
Owner Type
Purchase Details
Closed on
Apr 30, 2015
Sold by
Babai Sohrab J and Babai Ruth E
Bought by
Tammaro Eric J and Tammaro Andrea L
Current Estimated Value
Home Financials for this Owner
Home Financials are based on the most recent Mortgage that was taken out on this home.
Original Mortgage
$429,600
Outstanding Balance
$331,906
Interest Rate
3.76%
Mortgage Type
New Conventional
Estimated Equity
$509,694
Purchase Details
Closed on
Dec 12, 1989
Sold by
Miller Granger
Bought by
Babai Sohrab J
Home Financials for this Owner
Home Financials are based on the most recent Mortgage that was taken out on this home.
Original Mortgage
$160,000
Interest Rate
9.72%
Mortgage Type
Purchase Money Mortgage
Create a Home Valuation Report for This Property
The Home Valuation Report is an in-depth analysis detailing your home's value as well as a comparison with similar homes in the area
Home Values in the Area
Average Home Value in this Area
Purchase History
| Date | Buyer | Sale Price | Title Company |
|---|---|---|---|
| Tammaro Eric J | $537,000 | -- | |
| Babai Sohrab J | $209,000 | -- |
Source: Public Records
Mortgage History
| Date | Status | Borrower | Loan Amount |
|---|---|---|---|
| Open | Tammaro Eric J | $429,600 | |
| Previous Owner | Babai Sohrab J | $160,000 | |
| Previous Owner | Babai Sohrab J | $23,000 |
Source: Public Records
Tax History
| Year | Tax Paid | Tax Assessment Tax Assessment Total Assessment is a certain percentage of the fair market value that is determined by local assessors to be the total taxable value of land and additions on the property. | Land | Improvement |
|---|---|---|---|---|
| 2025 | $13,024 | $745,100 | $515,600 | $229,500 |
| 2024 | $12,317 | $700,600 | $473,000 | $227,600 |
| 2023 | $12,098 | $650,800 | $442,000 | $208,800 |
| 2022 | $11,212 | $567,700 | $368,300 | $199,400 |
| 2021 | $11,061 | $541,400 | $347,600 | $193,800 |
| 2020 | $10,287 | $541,400 | $347,600 | $193,800 |
| 2019 | $10,217 | $526,400 | $332,600 | $193,800 |
| 2018 | $10,070 | $519,900 | $326,100 | $193,800 |
| 2017 | $9,779 | $498,400 | $304,600 | $193,800 |
| 2016 | $9,695 | $482,100 | $304,600 | $177,500 |
| 2015 | -- | $439,100 | $277,400 | $161,700 |
| 2014 | $8,243 | $401,100 | $252,000 | $149,100 |
Source: Public Records
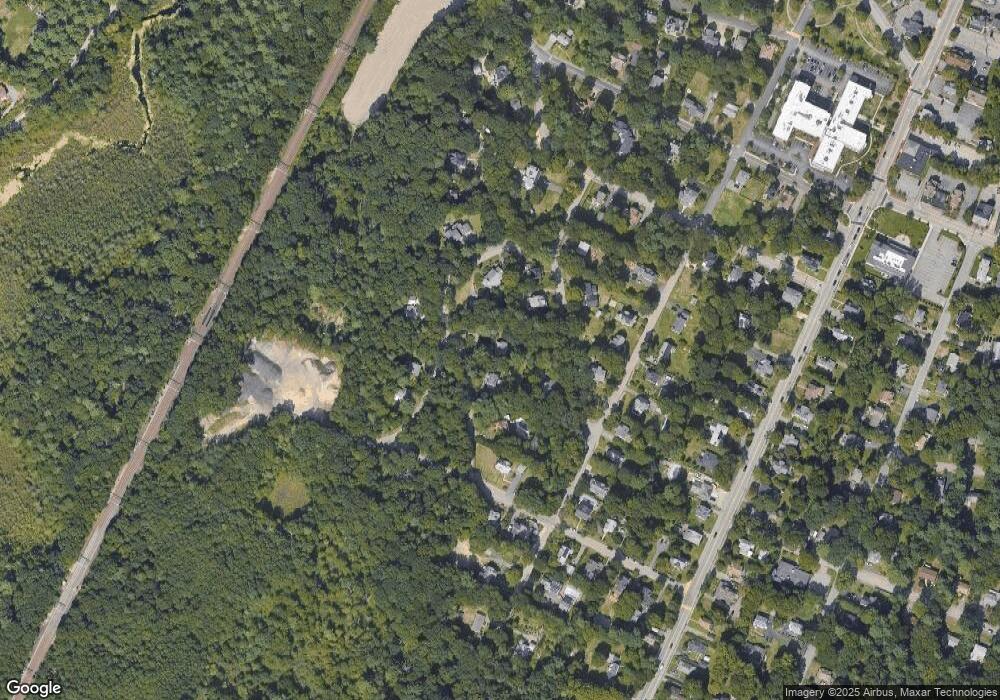
Map
Nearby Homes
- 29 Station St
- 5 Trowel Pond Shop Rd Unit C
- 22 Ames Ct
- 32 Billings St Unit A
- 58 Ames St
- 27 Sandy Ridge Cir
- 63 Highland St
- 133 Ames St
- 136 N Main St
- 15 Paul Revere Rd
- 277 Everett St
- 174 E Foxboro St
- 132 Massapoag Ave
- 3 Trowel Shop Pond Rd Unit 3
- 20 Trowel Shop Pond Rd Unit 24
- 16 Trowel Shop Pond Rd Unit 16
- 8 Trowel Shop Pond Rd Unit 8
- 2 Trowel Shop Pond Rd Unit 2
- 12 Trowel Shop Pond Rd Unit 12
- 24 Trowel Shop Pond Rd Unit 24
Your Personal Tour Guide
Ask me questions while you tour the home.