Estimated Value: $1,004,413 - $1,128,000
5
Beds
3
Baths
2,654
Sq Ft
$410/Sq Ft
Est. Value
About This Home
This home is located at 4 Torrington Ln, Acton, MA 01720 and is currently estimated at $1,089,353, approximately $410 per square foot. 4 Torrington Ln is a home located in Middlesex County with nearby schools including Acton-Boxborough Regional High School, Maynard Knowledge Beginnings, and The Imago School.
Ownership History
Date
Name
Owned For
Owner Type
Purchase Details
Closed on
May 30, 2007
Sold by
Bisognano Joseph P
Bought by
Bisognano Joseph P
Current Estimated Value
Purchase Details
Closed on
Apr 2, 2007
Sold by
Torrington Lane Rt and Bisognano Doreen
Bought by
Bisognano Joseph P
Purchase Details
Closed on
Nov 22, 2004
Sold by
Bisognano Doreen and Bisognano Joseph P
Bought by
Bisognano Doreen and Bisognano Joseph P
Create a Home Valuation Report for This Property
The Home Valuation Report is an in-depth analysis detailing your home's value as well as a comparison with similar homes in the area
Home Values in the Area
Average Home Value in this Area
Purchase History
| Date | Buyer | Sale Price | Title Company |
|---|---|---|---|
| Bisognano Joseph P | -- | -- | |
| Bisognano Joseph P | $567,000 | -- | |
| Bisognano Doreen | -- | -- |
Source: Public Records
Tax History
| Year | Tax Paid | Tax Assessment Tax Assessment Total Assessment is a certain percentage of the fair market value that is determined by local assessors to be the total taxable value of land and additions on the property. | Land | Improvement |
|---|---|---|---|---|
| 2025 | $15,816 | $922,200 | $344,000 | $578,200 |
| 2024 | $14,758 | $885,300 | $344,000 | $541,300 |
| 2023 | $14,397 | $819,900 | $312,800 | $507,100 |
| 2022 | $13,601 | $699,300 | $271,800 | $427,500 |
| 2021 | $13,510 | $667,800 | $251,900 | $415,900 |
| 2020 | $12,735 | $661,900 | $251,900 | $410,000 |
| 2019 | $12,219 | $630,800 | $251,900 | $378,900 |
| 2018 | $11,992 | $618,800 | $251,900 | $366,900 |
| 2017 | $11,863 | $622,400 | $251,900 | $370,500 |
| 2016 | $11,613 | $603,900 | $251,900 | $352,000 |
| 2015 | $11,226 | $589,300 | $251,900 | $337,400 |
| 2014 | $10,818 | $556,200 | $251,900 | $304,300 |
Source: Public Records
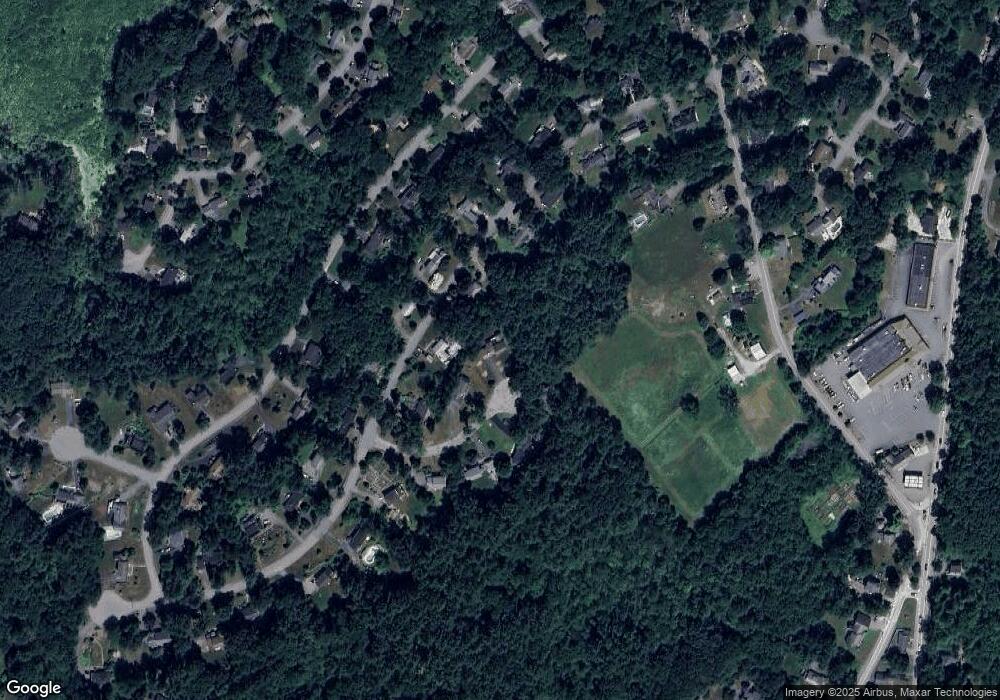
Map
Nearby Homes
- 246 Main St Unit 2
- 184 Main St Unit 3
- 7 Kelley Rd
- 25 Nylander Way
- 129 Main St Unit 129
- 131 Main St
- 20 Joseph Reed Ln
- 235 Arlington St
- 90 Willow St Unit 1
- 92 Willow St Unit 3
- 92 Willow St Unit 2
- 40 High St
- 70 River St
- 79 Charter Rd
- 18 Hayward Rd
- 30 Brewster Ln
- 1 Vanderbelt Rd
- 5 Perkins Ln
- 46 Taylor Rd
- 7 Hillcrest Dr
Your Personal Tour Guide
Ask me questions while you tour the home.