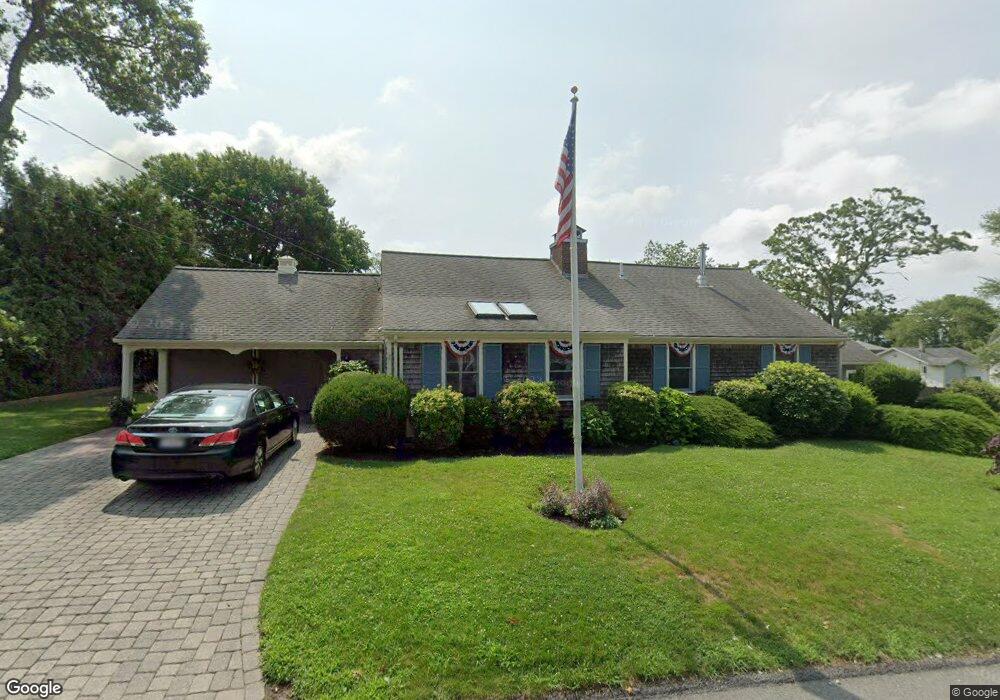
4 Tradewind Ln South Dartmouth, MA 02748
Redgate Corner/South Dartmouth NeighborhoodEstimated Value: $794,000 - $966,000
3
Beds
3
Baths
1,996
Sq Ft
$429/Sq Ft
Est. Value
About This Home
This home is located at 4 Tradewind Ln, South Dartmouth, MA 02748 and is currently estimated at $856,252, approximately $428 per square foot. 4 Tradewind Ln is a home located in Bristol County with nearby schools including Dartmouth High School and St. Teresa of Calcutta School.
Ownership History
Date
Name
Owned For
Owner Type
Purchase Details
Closed on
May 23, 2022
Sold by
Kelly Thomas E and Kelly Anne M
Bought by
T E & Anne M Kelly Ret
Current Estimated Value
Purchase Details
Closed on
Mar 17, 1976
Bought by
Kelly Thomas E and Kelly Anne M
Create a Home Valuation Report for This Property
The Home Valuation Report is an in-depth analysis detailing your home's value as well as a comparison with similar homes in the area
Home Values in the Area
Average Home Value in this Area
Purchase History
| Date | Buyer | Sale Price | Title Company |
|---|---|---|---|
| T E & Anne M Kelly Ret | -- | None Available | |
| Kelly Thomas E | -- | -- |
Source: Public Records
Mortgage History
| Date | Status | Borrower | Loan Amount |
|---|---|---|---|
| Previous Owner | Kelly Thomas E | $100,000 | |
| Previous Owner | Kelly Thomas E | $46,000 |
Source: Public Records
Tax History Compared to Growth
Tax History
| Year | Tax Paid | Tax Assessment Tax Assessment Total Assessment is a certain percentage of the fair market value that is determined by local assessors to be the total taxable value of land and additions on the property. | Land | Improvement |
|---|---|---|---|---|
| 2025 | $5,885 | $683,500 | $335,200 | $348,300 |
| 2024 | $5,738 | $660,300 | $320,700 | $339,600 |
| 2023 | $5,544 | $604,600 | $291,500 | $313,100 |
| 2022 | $5,387 | $544,100 | $274,000 | $270,100 |
| 2021 | $5,380 | $519,300 | $251,800 | $267,500 |
| 2020 | $5,223 | $503,200 | $257,500 | $245,700 |
| 2019 | $5,171 | $497,200 | $254,700 | $242,500 |
| 2018 | $4,637 | $456,500 | $247,600 | $208,900 |
| 2017 | $4,484 | $447,500 | $246,900 | $200,600 |
| 2016 | $4,366 | $429,700 | $230,900 | $198,800 |
| 2015 | $4,042 | $398,600 | $213,800 | $184,800 |
| 2014 | $3,699 | $362,300 | $181,400 | $180,900 |
Source: Public Records
Map
Nearby Homes
- 48 Wilson St
- 76 Shipyard Ln
- 21 Avis St
- 179 Rockland St
- 212 Rockland St
- 00 Prospect St
- 75 Country Way Unit 75
- 3 Mishawum Dr
- 5 Samosett Dr
- 40 School St
- 6 Jacob Dr
- 360 Russells Mills Rd
- 0 Stoneledge Rd
- 34 Country Way
- 2 Spinnaker Ln
- 59 Hidden Bay Dr
- 15 Puritan St
- 23 High St
- 1 Walter St
- 33 Rosewood Terrace