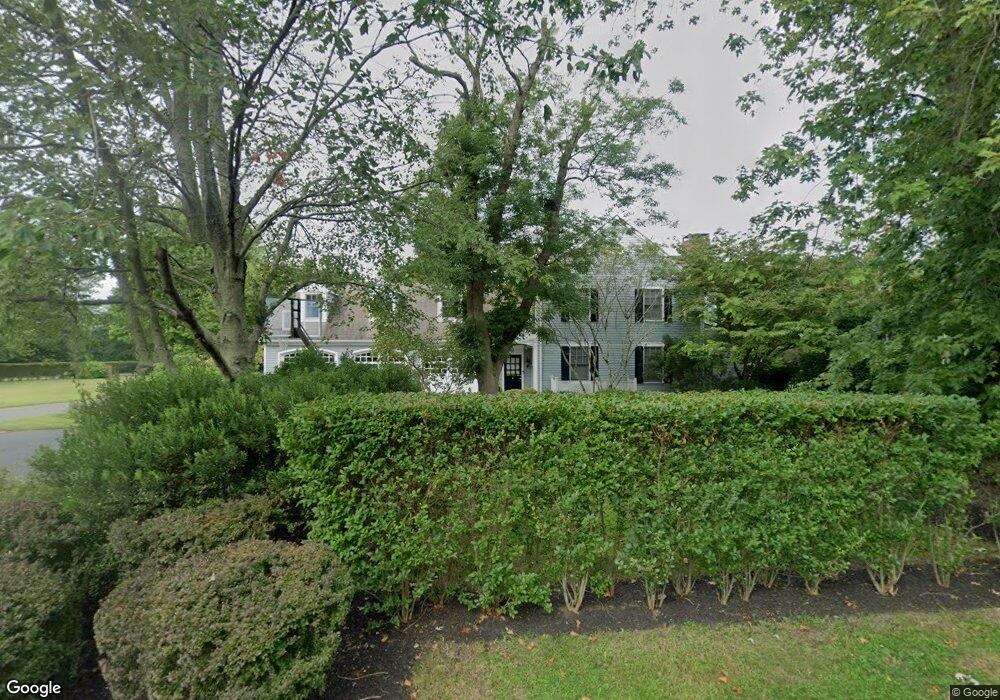
4 Tyson Ln Rumson, NJ 07760
Estimated Value: $4,361,795 - $5,410,000
7
Beds
6
Baths
6,807
Sq Ft
$713/Sq Ft
Est. Value
About This Home
This home is located at 4 Tyson Ln, Rumson, NJ 07760 and is currently estimated at $4,853,598, approximately $713 per square foot. 4 Tyson Ln is a home located in Monmouth County with nearby schools including Deane Porter School, Forrestdale School, and Rumson Fair Haven Regional High School.
Ownership History
Date
Name
Owned For
Owner Type
Purchase Details
Closed on
Mar 14, 2005
Sold by
Yanney Christopher M
Bought by
Minnetian Matthew J and Minnetian Jeremy
Current Estimated Value
Home Financials for this Owner
Home Financials are based on the most recent Mortgage that was taken out on this home.
Original Mortgage
$1,000,000
Outstanding Balance
$486,362
Interest Rate
5%
Mortgage Type
Adjustable Rate Mortgage/ARM
Estimated Equity
$4,367,236
Purchase Details
Closed on
Feb 17, 2004
Sold by
Delaney Frank
Bought by
Yanney Elsie and Yanney Christopher
Home Financials for this Owner
Home Financials are based on the most recent Mortgage that was taken out on this home.
Original Mortgage
$650,000
Interest Rate
5.71%
Create a Home Valuation Report for This Property
The Home Valuation Report is an in-depth analysis detailing your home's value as well as a comparison with similar homes in the area
Home Values in the Area
Average Home Value in this Area
Purchase History
| Date | Buyer | Sale Price | Title Company |
|---|---|---|---|
| Minnetian Matthew J | -- | -- | |
| Yanney Elsie | $2,550,000 | -- |
Source: Public Records
Mortgage History
| Date | Status | Borrower | Loan Amount |
|---|---|---|---|
| Open | Minnetian Matthew J | $1,000,000 | |
| Previous Owner | Yanney Elsie | $650,000 |
Source: Public Records
Tax History
| Year | Tax Paid | Tax Assessment Tax Assessment Total Assessment is a certain percentage of the fair market value that is determined by local assessors to be the total taxable value of land and additions on the property. | Land | Improvement |
|---|---|---|---|---|
| 2025 | $36,648 | $3,573,500 | $1,868,400 | $1,705,100 |
| 2024 | $37,613 | $3,331,600 | $1,779,900 | $1,551,700 |
Source: Public Records
Map
Nearby Homes
- 7 Belknap Ln
- 50 Rumson Rd
- 2 Shrewsbury Dr
- 21 Lincoln Ave
- 3 Monmouth Ave
- 8 Black Point Horseshoe
- 14 Ridge Rd
- 3 Black Point Horseshoe
- 132 Avenue of Two Rivers
- 9 South St
- 7 South St
- 11 South St
- 10 South St
- 2 Tulip Tree Ln
- 24 Surf St
- 121 Black Point Rd
- 61 Center St
- 6 Beach St
- 22 Rosalie Ave
- 1184 Ocean Ave Unit A3
Your Personal Tour Guide
Ask me questions while you tour the home.