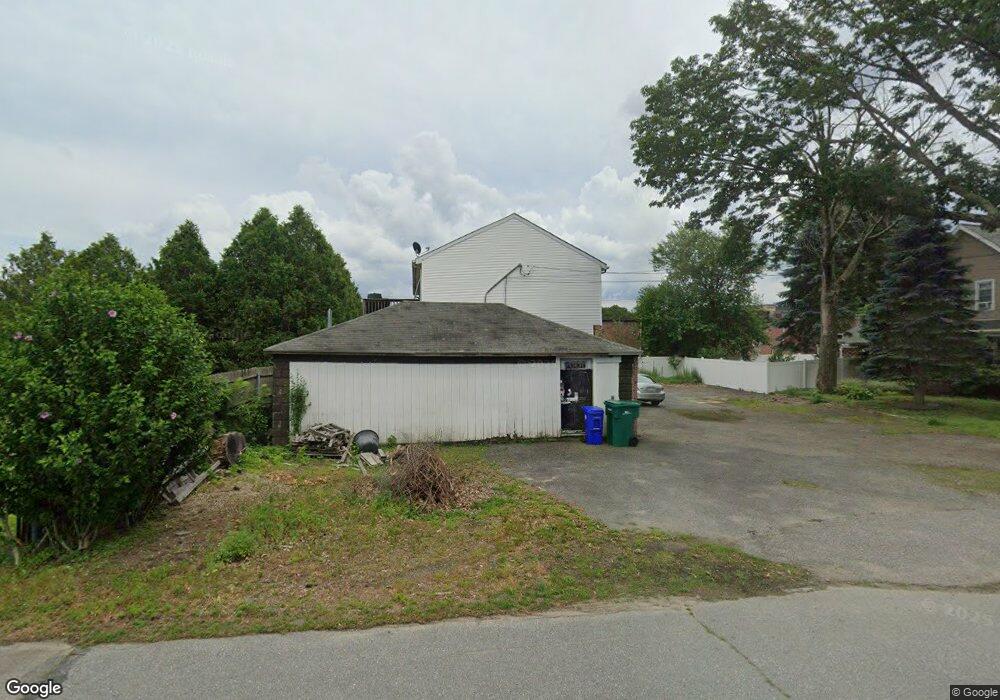
4 Tyson Place Attleboro, MA 02703
Estimated Value: $391,000 - $462,892
2
Beds
2
Baths
1,096
Sq Ft
$398/Sq Ft
Est. Value
About This Home
This home is located at 4 Tyson Place, Attleboro, MA 02703 and is currently estimated at $435,973, approximately $397 per square foot. 4 Tyson Place is a home located in Bristol County with nearby schools including Hill-Roberts Elementary School, Robert J. Coelho Middle School, and Attleboro High School.
Ownership History
Date
Name
Owned For
Owner Type
Purchase Details
Closed on
Feb 28, 2023
Sold by
Rodrigues John L and Rodrigues Keri K
Bought by
Rodrigues John L
Current Estimated Value
Purchase Details
Closed on
Jun 14, 2010
Sold by
Keane Kristen A and Keane Andrew J
Bought by
Rodrigues John L and Rodrigues Keri K
Create a Home Valuation Report for This Property
The Home Valuation Report is an in-depth analysis detailing your home's value as well as a comparison with similar homes in the area
Home Values in the Area
Average Home Value in this Area
Purchase History
| Date | Buyer | Sale Price | Title Company |
|---|---|---|---|
| Rodrigues John L | -- | None Available | |
| Rodrigues John L | $135,000 | -- |
Source: Public Records
Tax History Compared to Growth
Tax History
| Year | Tax Paid | Tax Assessment Tax Assessment Total Assessment is a certain percentage of the fair market value that is determined by local assessors to be the total taxable value of land and additions on the property. | Land | Improvement |
|---|---|---|---|---|
| 2025 | $4,585 | $365,300 | $124,800 | $240,500 |
| 2024 | $4,587 | $360,300 | $124,800 | $235,500 |
| 2023 | $4,407 | $321,900 | $113,400 | $208,500 |
| 2022 | $4,267 | $295,300 | $108,100 | $187,200 |
| 2021 | $3,918 | $264,700 | $103,900 | $160,800 |
| 2020 | $3,841 | $263,800 | $100,900 | $162,900 |
| 2019 | $3,574 | $252,400 | $98,900 | $153,500 |
| 2018 | $6,541 | $228,100 | $96,000 | $132,100 |
| 2017 | $3,342 | $229,700 | $96,000 | $133,700 |
| 2016 | $3,118 | $210,400 | $94,200 | $116,200 |
| 2015 | $2,846 | $193,500 | $94,200 | $99,300 |
| 2014 | $2,770 | $186,500 | $89,800 | $96,700 |
Source: Public Records
Map
Nearby Homes
- 12 Tyson Place
- 23 Magnolia St Unit 2
- 44 Buffington St
- 2 Gardner Ave
- 49 Gardner Ave
- 39 Slade Ave
- 103 Hall Ave
- 52 Curtis Ave
- 980 Newport Ave
- 330 Brown St
- 130 Zoar Ave
- 171 Mendon Rd
- 58 Baltic St Unit 58
- 56 Baltic St Unit 56
- 64 Highland Ave Unit A
- 64 Highland Ave Unit B
- 18 Newton St
- 1 Jessicas Way
- 6 Castle Rd
- 55 Leedham St Unit 2-6
- 655 Washington St
- 8 Tyson Place
- 34 Brown St
- 34 Brown St Unit B
- 34 Brown St Unit A
- 637 Washington St Unit 6
- 19 Tyson Place
- 27 Brown St
- 660 Washington St
- 2 Rand Ave
- 649 Washington St
- 0 Leedham & Brown St
- 2 Sycamore Ave
- 21 Tyson Place
- 40 Brown St
- 670 Washington St
- 2 lots Brown St
- 14 Rand Ave
- 27 Tyson Place
- 42 Oak Square