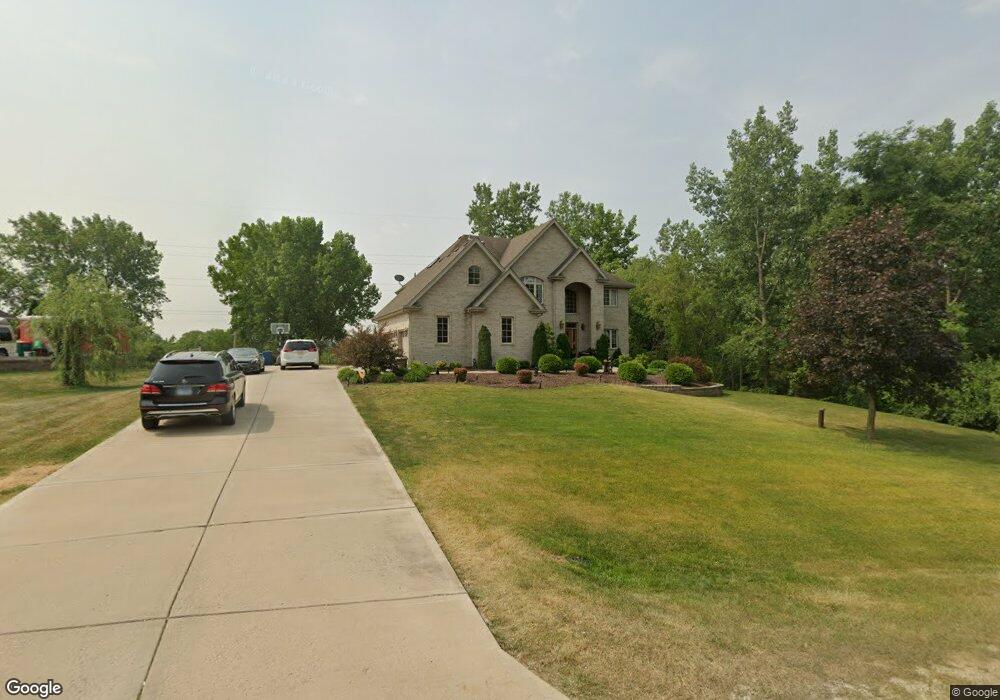
4 Valley View Ct Lemont, IL 60439
West Lemont NeighborhoodEstimated Value: $587,000 - $699,903
4
Beds
3
Baths
2,837
Sq Ft
$234/Sq Ft
Est. Value
About This Home
This home is located at 4 Valley View Ct, Lemont, IL 60439 and is currently estimated at $664,976, approximately $234 per square foot. 4 Valley View Ct is a home located in Cook County with nearby schools including Oakwood School, River Valley School, and Old Quarry Middle School.
Ownership History
Date
Name
Owned For
Owner Type
Purchase Details
Closed on
Mar 14, 2020
Sold by
Cronin Amber L and Leatherman Bruce L
Bought by
Cronin Scott A and Cronin Amber L
Current Estimated Value
Home Financials for this Owner
Home Financials are based on the most recent Mortgage that was taken out on this home.
Original Mortgage
$324,600
Outstanding Balance
$285,367
Interest Rate
3.12%
Mortgage Type
New Conventional
Estimated Equity
$379,609
Purchase Details
Closed on
Apr 2, 2012
Sold by
Hartl Lawrence E and Hartl Janie T
Bought by
Cronin Amber L and Leatherman Bruce L
Home Financials for this Owner
Home Financials are based on the most recent Mortgage that was taken out on this home.
Original Mortgage
$290,932
Interest Rate
2.75%
Mortgage Type
FHA
Purchase Details
Closed on
Jul 23, 1999
Sold by
Sokolis William T and Sokolis Anita
Bought by
Hartl Lawrence E and Hartl Janie T
Home Financials for this Owner
Home Financials are based on the most recent Mortgage that was taken out on this home.
Original Mortgage
$240,000
Interest Rate
7.69%
Create a Home Valuation Report for This Property
The Home Valuation Report is an in-depth analysis detailing your home's value as well as a comparison with similar homes in the area
Home Values in the Area
Average Home Value in this Area
Purchase History
| Date | Buyer | Sale Price | Title Company |
|---|---|---|---|
| Cronin Scott A | -- | Old Republic Title | |
| Cronin Amber L | $298,500 | First American Title | |
| Hartl Lawrence E | $307,500 | -- |
Source: Public Records
Mortgage History
| Date | Status | Borrower | Loan Amount |
|---|---|---|---|
| Open | Cronin Scott A | $324,600 | |
| Closed | Cronin Amber L | $290,932 | |
| Previous Owner | Hartl Lawrence E | $240,000 |
Source: Public Records
Tax History Compared to Growth
Tax History
| Year | Tax Paid | Tax Assessment Tax Assessment Total Assessment is a certain percentage of the fair market value that is determined by local assessors to be the total taxable value of land and additions on the property. | Land | Improvement |
|---|---|---|---|---|
| 2024 | $10,115 | $55,493 | $28,993 | $26,500 |
| 2023 | $8,499 | $55,493 | $28,993 | $26,500 |
| 2022 | $8,499 | $41,151 | $5,576 | $35,575 |
| 2021 | $8,276 | $41,150 | $5,575 | $35,575 |
| 2020 | $8,445 | $41,150 | $5,575 | $35,575 |
| 2019 | $8,745 | $43,985 | $5,575 | $38,410 |
| 2018 | $8,608 | $43,985 | $5,575 | $38,410 |
| 2017 | $8,506 | $43,985 | $5,575 | $38,410 |
| 2016 | $7,207 | $35,270 | $4,460 | $30,810 |
| 2015 | $7,306 | $35,270 | $4,460 | $30,810 |
| 2014 | $7,403 | $35,270 | $4,460 | $30,810 |
| 2013 | $7,617 | $38,426 | $8,921 | $29,505 |
Source: Public Records
Map
Nearby Homes
- 16701 135th St
- 13027 Blue Grass Dr
- 16560 Kayla Dr
- 16550 Kayla Dr
- 16540 Kayla Dr
- 16530 Kayla Dr
- Ravello Plan at Villas at Rolling Meadows
- Verona Plan at Villas at Rolling Meadows
- Capri Plan at Villas at Rolling Meadows
- Sorrento Plan at Villas at Rolling Meadows
- 16520 Kayla Dr
- 16541 Kayla Dr
- 16451 Kayla Dr
- 12891 Mayfair Dr
- 16705 W 138th St
- 17365 W 135th St
- 1365 Gordon Ln
- 1383 Gordon Ln
- 15822 132nd St
- 16520 Tameling Dr
- 5 Valley View Ct
- 3 Valley View Ct
- 13201 Smith Rd
- 4 Longwood Way Unit 1
- 2 Valley View Ct
- 6 Longwood Way
- 7 Valley View Dr
- 2 Valley View Dr
- 4 Valley View Dr
- 8 Longwood Way
- 1 Longwood Way
- 6 Valley View Dr
- 3 Longwood Way
- 5 Longwood Way
- 1304 Oakmont Dr
- 9 Longwood Way
- 10 Longwood Way
- 8 Valley View Dr
- 7 Longwood Way
- 11 Longwood Way