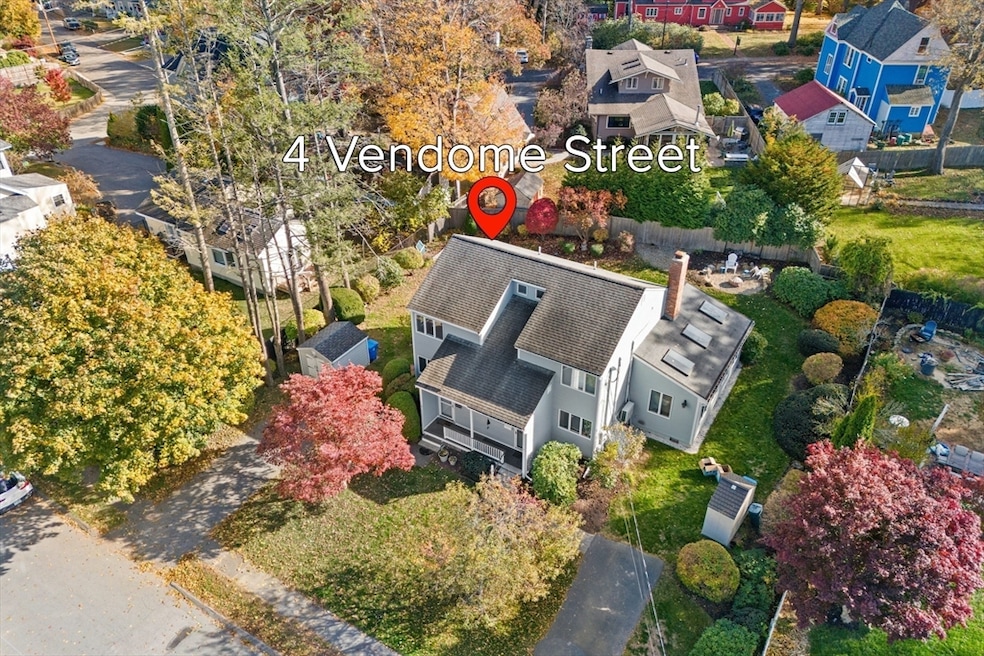
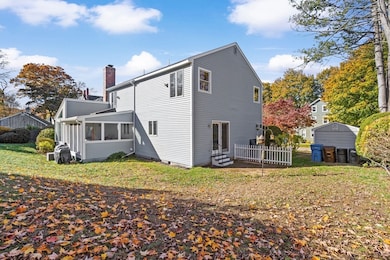
4 Vendome St Unit 2 Merrimac, MA 01860
Estimated payment $2,378/month
Highlights
- Property is near public transit
- Jogging Path
- Cooling System Mounted In Outer Wall Opening
- End Unit
- Porch
- Patio
About This Home
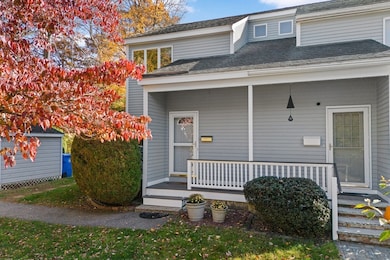
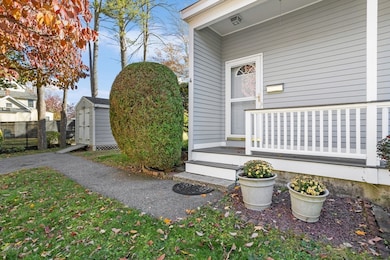
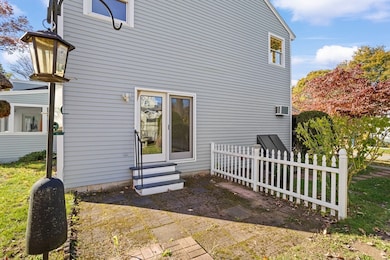
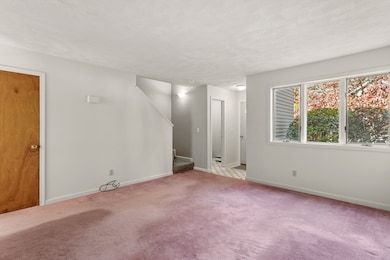
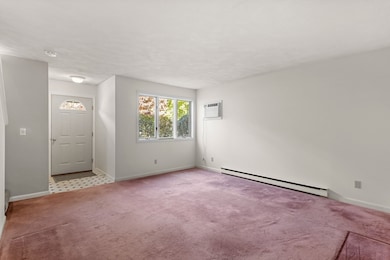
Welcome to 4 Vendome Street in beautiful Merrimac! A 5 room, 2 bedroom home nestled on a quiet side street just around the corner from the downtown center. This townhouse/duplex offers bright, flexible living spaces including an eat in kitchen with large dining area, large living room, and 2 comfortable bedrooms designed for everyday living. Enjoy the outdoor patio off the kitchen and the convenience of the included storage shed. Located close to parks, schools, and the Merrimack River, with quick access to I-495 for commuting to Newburyport, Amesbury, the NH Seacoast, and all places north and south. A wonderful blend of small-town character and commuter convenience! Don't miss out on this opportunity to make this home your own! Investors please take note as well. Home being sold As is. No condo fees. Open House Saturday December 6th from 10AM to 12 PM
Listing Agent
Better Homes and Gardens Real Estate - The Masiello Group Listed on: 10/30/2025

Townhouse Details
Home Type
- Townhome
Est. Annual Taxes
- $3,776
Year Built
- Built in 1986
Lot Details
- End Unit
HOA Fees
- $44 Monthly HOA Fees
Home Design
- Half Duplex
- Entry on the 1st floor
- Blown Fiberglass Insulation
- Shingle Roof
Interior Spaces
- 1,034 Sq Ft Home
- 2-Story Property
- Dining Area
- Basement
- Exterior Basement Entry
Kitchen
- Range
- Dishwasher
Flooring
- Wall to Wall Carpet
- Vinyl
Bedrooms and Bathrooms
- 2 Bedrooms
- Primary bedroom located on second floor
Laundry
- Laundry on main level
- Dryer
- Washer
Parking
- 2 Car Parking Spaces
- Paved Parking
- Open Parking
- Off-Street Parking
Outdoor Features
- Patio
- Outdoor Storage
- Porch
Location
- Property is near public transit
- Property is near schools
Schools
- Pentucket Middle School
- Pentucke High School
Utilities
- Cooling System Mounted In Outer Wall Opening
- 6 Heating Zones
- Electric Baseboard Heater
- 100 Amp Service
Listing and Financial Details
- Legal Lot and Block A / 3-7
- Assessor Parcel Number 2034236
Community Details
Overview
- Association fees include insurance
- 2 Units
- Unicorn Condominiums Community
Amenities
- Shops
Recreation
- Park
- Jogging Path
Pet Policy
- Pets Allowed
Map
Home Values in the Area
Average Home Value in this Area
Tax History
| Year | Tax Paid | Tax Assessment Tax Assessment Total Assessment is a certain percentage of the fair market value that is determined by local assessors to be the total taxable value of land and additions on the property. | Land | Improvement |
|---|---|---|---|---|
| 2025 | $3,776 | $285,000 | $0 | $285,000 |
| 2024 | $3,794 | $281,000 | $0 | $281,000 |
| 2023 | $3,920 | $265,400 | $0 | $265,400 |
| 2022 | $3,954 | $242,000 | $0 | $242,000 |
| 2021 | $3,244 | $199,000 | $0 | $199,000 |
| 2020 | $2,759 | $185,400 | $0 | $185,400 |
| 2019 | $2,702 | $170,900 | $0 | $170,900 |
| 2018 | $2,652 | $168,300 | $0 | $168,300 |
| 2017 | $2,533 | $155,000 | $0 | $155,000 |
| 2016 | $2,419 | $149,700 | $0 | $149,700 |
| 2015 | $2,337 | $143,800 | $0 | $143,800 |
| 2014 | $2,285 | $143,800 | $0 | $143,800 |
Property History
| Date | Event | Price | List to Sale | Price per Sq Ft |
|---|---|---|---|---|
| 11/24/2025 11/24/25 | Price Changed | $385,000 | -3.7% | $372 / Sq Ft |
| 10/30/2025 10/30/25 | For Sale | $399,900 | -- | $387 / Sq Ft |
Purchase History
| Date | Type | Sale Price | Title Company |
|---|---|---|---|
| Quit Claim Deed | -- | None Available | |
| Quit Claim Deed | -- | None Available | |
| Deed | -- | -- | |
| Deed | -- | -- | |
| Deed | $70,000 | -- | |
| Deed | $70,000 | -- | |
| Deed | $109,900 | -- |
Mortgage History
| Date | Status | Loan Amount | Loan Type |
|---|---|---|---|
| Previous Owner | $84,000 | Purchase Money Mortgage | |
| Previous Owner | $66,500 | Purchase Money Mortgage |
Source: MLS Property Information Network (MLS PIN)
MLS Number: 73449607
APN: MERR-000009B-000003-000007-A000000-A000000
Disclaimer: Certain information contained herein is derived from information provided by parties other than Homes.com. All information provided is deemed reliable, but is not guaranteed to be accurate and should be independently verified.
![]() The property listing data and information, or the Images, set forth herein were provided to MLS Property Information Network, Inc. from third party sources, including sellers, lessors and public records, and were compiled by MLS Property Information Network, Inc. The property listing data and information, and the Images, are for the personal, non-commercial use of consumers having a good faith interest in purchasing or leasing listed properties of the type displayed to them and may not be used for any purpose other than to identify prospective properties which such consumers may have a good faith interest in purchasing or leasing. MLS Property Information Network, Inc. and its subscribers disclaim any and all representations and warranties as to the accuracy of the property listing data and information, or as to the accuracy of any of the Images, set forth herein.
The property listing data and information, or the Images, set forth herein were provided to MLS Property Information Network, Inc. from third party sources, including sellers, lessors and public records, and were compiled by MLS Property Information Network, Inc. The property listing data and information, and the Images, are for the personal, non-commercial use of consumers having a good faith interest in purchasing or leasing listed properties of the type displayed to them and may not be used for any purpose other than to identify prospective properties which such consumers may have a good faith interest in purchasing or leasing. MLS Property Information Network, Inc. and its subscribers disclaim any and all representations and warranties as to the accuracy of the property listing data and information, or as to the accuracy of any of the Images, set forth herein.
- 10 Vendome St Unit 10
- 1 Regency Village Way
- 2 Regency Village Way Unit 208
- 1 Regency Village Way Unit 316
- 329 Main St Unit 329
- 36 Haverhill Rd
- 157 Chase Rd
- 21 Mason Ct Unit 21
- 100 Whitehall Rd
- 18 Summer St Unit 18C
- 20 Ordway Ln
- 177 Main St Unit 177 Main St Amesbury
- 177 Main St Unit A
- 41 High St Unit 6
- 13 Aubin St
- 13 Aubin St
- 1 River Ct
- 178 Storey Ave
- 104 Elm St Unit 104 Elm St. Unit A
- 440 North Ave Unit 41