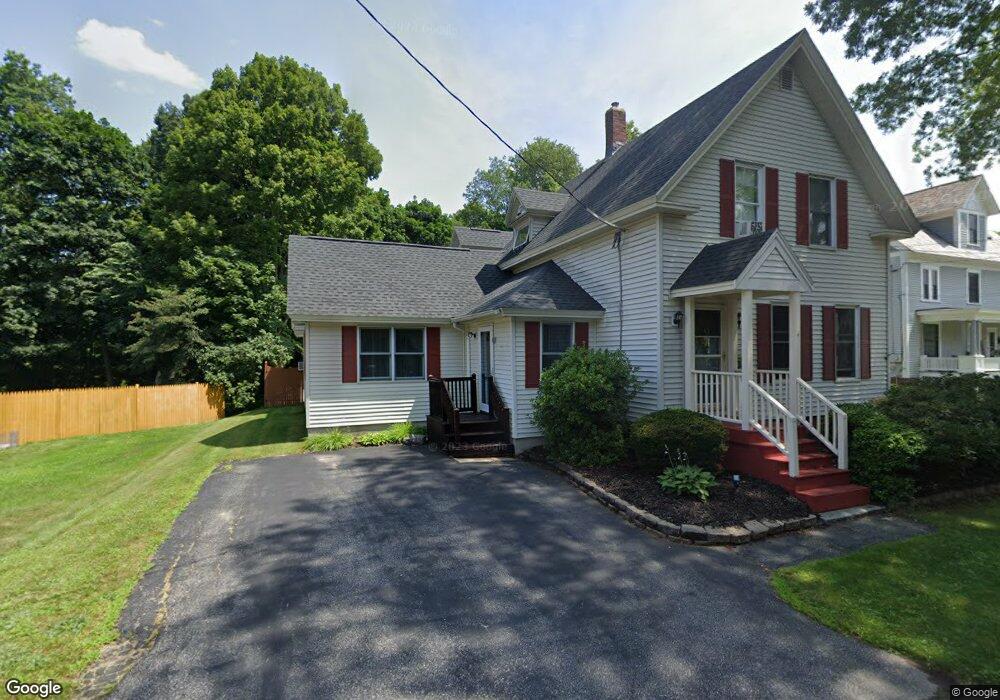
4 View St Concord, NH 03301
West Concord NeighborhoodEstimated Value: $478,000 - $596,000
4
Beds
2
Baths
2,632
Sq Ft
$205/Sq Ft
Est. Value
About This Home
This home is located at 4 View St, Concord, NH 03301 and is currently estimated at $538,282, approximately $204 per square foot. 4 View St is a home located in Merrimack County with nearby schools including Beaver Meadow School, Rundlett Middle School, and Concord High School.
Ownership History
Date
Name
Owned For
Owner Type
Purchase Details
Closed on
Sep 7, 1999
Sold by
Greene Maureen K
Bought by
Klose Philip C and Klose Susan J
Current Estimated Value
Home Financials for this Owner
Home Financials are based on the most recent Mortgage that was taken out on this home.
Original Mortgage
$122,000
Outstanding Balance
$32,726
Interest Rate
7.5%
Mortgage Type
Purchase Money Mortgage
Estimated Equity
$505,556
Create a Home Valuation Report for This Property
The Home Valuation Report is an in-depth analysis detailing your home's value as well as a comparison with similar homes in the area
Home Values in the Area
Average Home Value in this Area
Purchase History
| Date | Buyer | Sale Price | Title Company |
|---|---|---|---|
| Klose Philip C | $128,500 | -- |
Source: Public Records
Mortgage History
| Date | Status | Borrower | Loan Amount |
|---|---|---|---|
| Open | Klose Philip C | $50,000 | |
| Open | Klose Philip C | $122,000 |
Source: Public Records
Tax History
| Year | Tax Paid | Tax Assessment Tax Assessment Total Assessment is a certain percentage of the fair market value that is determined by local assessors to be the total taxable value of land and additions on the property. | Land | Improvement |
|---|---|---|---|---|
| 2025 | $11,126 | $382,200 | $108,200 | $274,000 |
| 2024 | $10,583 | $382,200 | $108,200 | $274,000 |
| 2023 | $10,271 | $382,400 | $108,200 | $274,200 |
| 2022 | $9,900 | $382,400 | $108,200 | $274,200 |
| 2021 | $9,606 | $382,400 | $108,200 | $274,200 |
| 2020 | $9,029 | $337,400 | $83,500 | $253,900 |
| 2019 | $8,651 | $311,400 | $82,000 | $229,400 |
| 2018 | $7,964 | $282,500 | $78,800 | $203,700 |
| 2017 | $7,571 | $268,100 | $78,200 | $189,900 |
| 2016 | $7,357 | $265,900 | $78,200 | $187,700 |
| 2015 | $6,450 | $235,900 | $66,300 | $169,600 |
| 2014 | $6,324 | $235,900 | $66,300 | $169,600 |
| 2013 | $6,034 | $235,900 | $66,300 | $169,600 |
| 2012 | $5,837 | $239,500 | $66,300 | $173,200 |
Source: Public Records
Map
Nearby Homes
- 11 Callaway Dr Unit 3
- 17 Callaway Dr Unit 5
- 35 Callaway Dr Unit 6
- 34 Callaway Dr Unit 4
- 34 Callaway Dr Unit 1
- 362 N State St
- 14 Knight St Unit 2
- 16 Piscataqua Rd
- 5 Piscataqua Rd
- 3 Piscataqua Rd
- 4 Otter Dr
- 11 Boanza Dr
- 441, 443 N State St
- 3 S Emperor Dr
- 61 Mountain Rd
- 36 N Emperor Dr
- 4 Tanager Cir Unit 8
- 4 Tanager Cir Unit 7
- 4 Tanager Cir Unit 5
- 4 Tanager Cir Unit 2
Your Personal Tour Guide
Ask me questions while you tour the home.