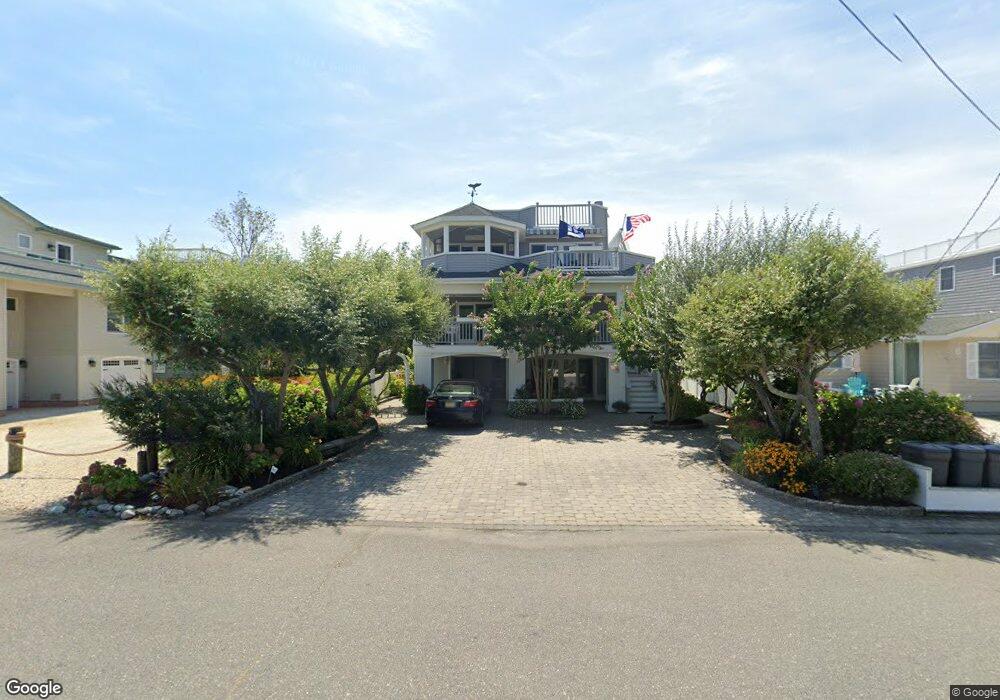
4 W 21st St Barnegat Light, NJ 08006
Long Beach Island NeighborhoodEstimated Value: $1,073,000 - $2,106,000
4
Beds
4
Baths
2,608
Sq Ft
$636/Sq Ft
Est. Value
About This Home
This home is located at 4 W 21st St, Barnegat Light, NJ 08006 and is currently estimated at $1,658,932, approximately $636 per square foot. 4 W 21st St is a home with nearby schools including Ethel A. Jacobsen Elementary School, Long Beach Island Grade School, and Southern Regional Middle School.
Ownership History
Date
Name
Owned For
Owner Type
Purchase Details
Closed on
Jul 6, 2012
Sold by
Toni Robert V
Bought by
Toni Robert
Current Estimated Value
Purchase Details
Closed on
Jul 9, 1999
Sold by
Toni Barbara A
Bought by
Toni Robert
Purchase Details
Closed on
Jul 25, 1997
Sold by
Carles John B and Carlesi Thomas
Bought by
Caledonian Advisors Ltd
Purchase Details
Closed on
Oct 27, 1995
Sold by
Dee Edmund
Bought by
Corsino Peter
Home Financials for this Owner
Home Financials are based on the most recent Mortgage that was taken out on this home.
Original Mortgage
$199,000
Interest Rate
7.58%
Purchase Details
Closed on
Sep 16, 1995
Sold by
Rothman E O Sidney
Bought by
Toni Robert and Toni Barbara
Home Financials for this Owner
Home Financials are based on the most recent Mortgage that was taken out on this home.
Original Mortgage
$199,000
Interest Rate
7.58%
Create a Home Valuation Report for This Property
The Home Valuation Report is an in-depth analysis detailing your home's value as well as a comparison with similar homes in the area
Home Values in the Area
Average Home Value in this Area
Purchase History
| Date | Buyer | Sale Price | Title Company |
|---|---|---|---|
| Toni Robert | -- | None Available | |
| Toni Robert | -- | -- | |
| Toni Barbara A | -- | -- | |
| Caledonian Advisors Ltd | $775,000 | -- | |
| Corsino Peter | $265,000 | -- | |
| Toni Robert | $135,000 | -- |
Source: Public Records
Mortgage History
| Date | Status | Borrower | Loan Amount |
|---|---|---|---|
| Previous Owner | Corsino Peter | $199,000 |
Source: Public Records
Tax History Compared to Growth
Tax History
| Year | Tax Paid | Tax Assessment Tax Assessment Total Assessment is a certain percentage of the fair market value that is determined by local assessors to be the total taxable value of land and additions on the property. | Land | Improvement |
|---|---|---|---|---|
| 2025 | $8,737 | $866,800 | $375,000 | $491,800 |
| 2024 | $7,723 | $866,800 | $375,000 | $491,800 |
| 2023 | $7,168 | $866,800 | $375,000 | $491,800 |
| 2022 | $7,168 | $866,800 | $375,000 | $491,800 |
| 2021 | $7,713 | $866,800 | $375,000 | $491,800 |
| 2020 | $7,827 | $866,800 | $375,000 | $491,800 |
| 2019 | $7,541 | $866,800 | $375,000 | $491,800 |
| 2018 | $7,411 | $866,800 | $375,000 | $491,800 |
| 2017 | $7,671 | $866,800 | $375,000 | $491,800 |
| 2016 | $7,472 | $866,800 | $375,000 | $491,800 |
| 2015 | $7,203 | $866,800 | $375,000 | $491,800 |
| 2014 | $7,839 | $867,200 | $375,000 | $492,200 |
Source: Public Records
Map
Nearby Homes