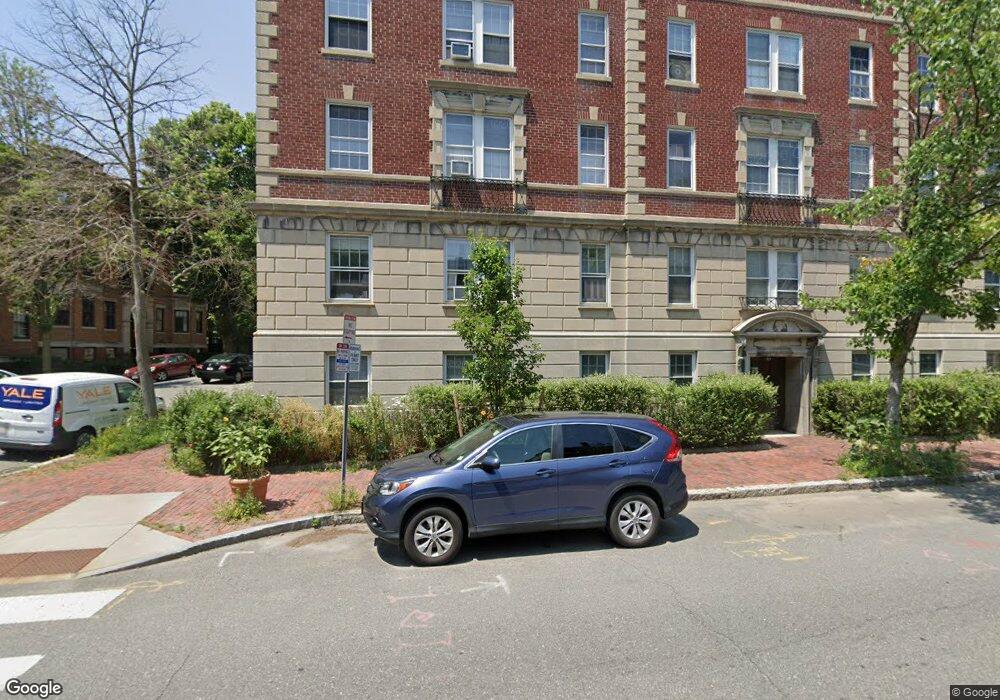
4 Washington Ave Unit 9 Cambridge, MA 02140
Neighborhood Nine NeighborhoodEstimated Value: $579,000 - $632,000
1
Bed
1
Bath
607
Sq Ft
$993/Sq Ft
Est. Value
About This Home
This home is located at 4 Washington Ave Unit 9, Cambridge, MA 02140 and is currently estimated at $602,507, approximately $992 per square foot. 4 Washington Ave Unit 9 is a home located in Middlesex County with nearby schools including St Peter School, Cambridge Montessori School, and Cambridge Friends School.
Ownership History
Date
Name
Owned For
Owner Type
Purchase Details
Closed on
Jul 23, 2015
Sold by
Calnan Ft
Bought by
Rrc Lt
Current Estimated Value
Purchase Details
Closed on
Jul 17, 2009
Sold by
Perlman Meryl Kersten
Bought by
Calnan Ft and Calnan Rita F
Purchase Details
Closed on
Aug 9, 2002
Sold by
Black Sharon
Bought by
Chew Robert
Home Financials for this Owner
Home Financials are based on the most recent Mortgage that was taken out on this home.
Original Mortgage
$225,000
Interest Rate
6.58%
Mortgage Type
Purchase Money Mortgage
Purchase Details
Closed on
Jul 28, 1993
Sold by
Dautremont Ruth E
Bought by
Black Sharon
Home Financials for this Owner
Home Financials are based on the most recent Mortgage that was taken out on this home.
Original Mortgage
$97,600
Interest Rate
7.32%
Mortgage Type
Purchase Money Mortgage
Purchase Details
Closed on
Mar 23, 1989
Sold by
Melithoniotes J
Bought by
Dautremont Ruth E
Create a Home Valuation Report for This Property
The Home Valuation Report is an in-depth analysis detailing your home's value as well as a comparison with similar homes in the area
Home Values in the Area
Average Home Value in this Area
Purchase History
| Date | Buyer | Sale Price | Title Company |
|---|---|---|---|
| Rrc Lt | -- | -- | |
| Calnan Ft | $332,000 | -- | |
| Chew Robert | $294,500 | -- | |
| Black Sharon | $122,000 | -- | |
| Dautremont Ruth E | $139,000 | -- |
Source: Public Records
Mortgage History
| Date | Status | Borrower | Loan Amount |
|---|---|---|---|
| Previous Owner | Chew Robert | $225,000 | |
| Previous Owner | Dautremont Ruth E | $140,250 | |
| Previous Owner | Dautremont Ruth E | $97,600 | |
| Previous Owner | Dautremont Ruth E | $128,599 |
Source: Public Records
Tax History Compared to Growth
Tax History
| Year | Tax Paid | Tax Assessment Tax Assessment Total Assessment is a certain percentage of the fair market value that is determined by local assessors to be the total taxable value of land and additions on the property. | Land | Improvement |
|---|---|---|---|---|
| 2025 | $3,576 | $563,100 | $0 | $563,100 |
| 2024 | $3,204 | $541,300 | $0 | $541,300 |
| 2023 | $3,284 | $560,400 | $0 | $560,400 |
| 2022 | $3,608 | $609,400 | $0 | $609,400 |
| 2021 | $3,652 | $624,200 | $0 | $624,200 |
| 2020 | $3,592 | $624,700 | $0 | $624,700 |
| 2019 | $3,439 | $579,000 | $0 | $579,000 |
| 2018 | $3,420 | $530,800 | $0 | $530,800 |
| 2017 | $3,112 | $479,500 | $0 | $479,500 |
| 2016 | $2,926 | $418,600 | $0 | $418,600 |
| 2015 | $2,895 | $370,200 | $0 | $370,200 |
| 2014 | $2,754 | $328,600 | $0 | $328,600 |
Source: Public Records
Map
Nearby Homes
- 22 Agassiz St
- 43 Linnaean St Unit 42
- 86 Avon Hill St
- 69A Walker St Unit A
- 3 Arlington St Unit 52
- 9 Chauncy St Unit 61
- 13 Mellen St Unit Front
- 202 Garden St
- 15-15A Forest St
- 1600 Massachusetts Ave Unit 404
- 24 Cambridge Terrace Unit 2
- 84 Garden St
- 52 Garden St Unit B2
- 31-33 Mellen St
- 44 Garden St
- 35 Mellen St
- 1 Richdale Ave Unit 2
- 72 Oxford St Unit 72
- 72 Oxford St
- 74 Oxford St
- 4 Washington Ave Unit 12A
- 4 Washington Ave Unit 23
- 4 Washington Ave Unit 22
- 4 Washington Ave Unit 21
- 4 Washington Ave Unit 19
- 4 Washington Ave Unit 18
- 4 Washington Ave Unit 17
- 4 Washington Ave Unit 16
- 4 Washington Ave Unit 15
- 4 Washington Ave Unit 14
- 4 Washington Ave Unit 12
- 4 Washington Ave Unit 11
- 4 Washington Ave Unit 10
- 4 Washington Ave Unit 8
- 4 Washington Ave Unit 7
- 4 Washington Ave Unit 6
- 4 Washington Ave Unit 5
- 4 Washington Ave
- 4 Washington Ave Unit 3
- 4 Washington Ave Unit 2