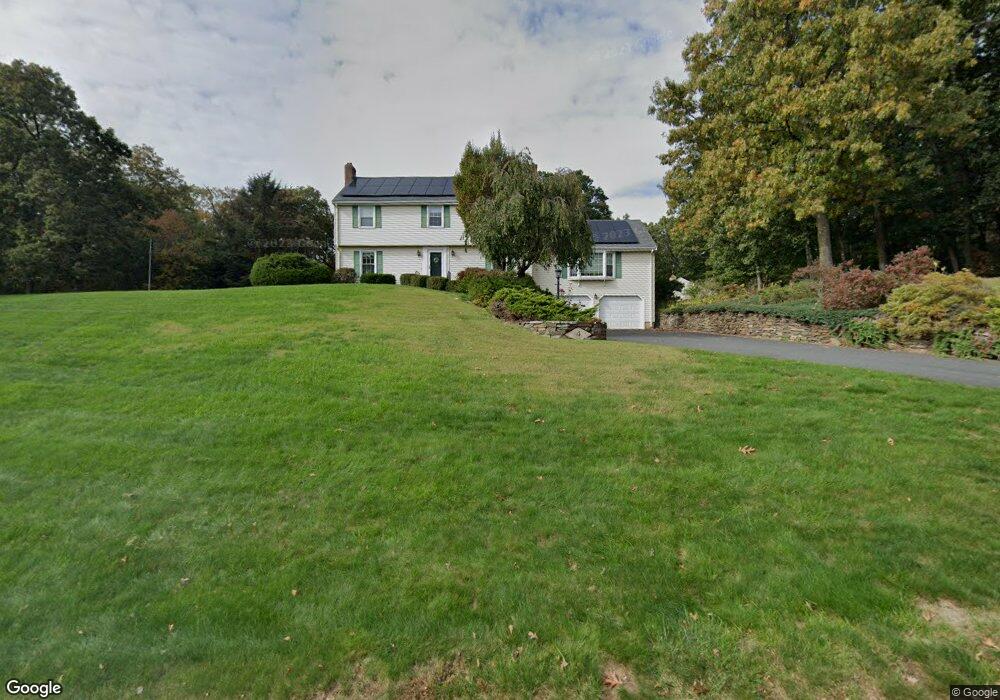
4 Wells Rd Ellington, CT 06029
Estimated Value: $638,000 - $698,000
4
Beds
3
Baths
2,742
Sq Ft
$244/Sq Ft
Est. Value
About This Home
This home is located at 4 Wells Rd, Ellington, CT 06029 and is currently estimated at $670,202, approximately $244 per square foot. 4 Wells Rd is a home located in Tolland County with nearby schools including Ellington High School.
Ownership History
Date
Name
Owned For
Owner Type
Purchase Details
Closed on
May 23, 2023
Sold by
Peck Kim M and Dias John J
Bought by
Peck Kim M and Dias John J
Current Estimated Value
Purchase Details
Closed on
Apr 29, 2015
Sold by
Dias John J
Bought by
Peck Kim M and Dias John J
Home Financials for this Owner
Home Financials are based on the most recent Mortgage that was taken out on this home.
Original Mortgage
$315,200
Interest Rate
3.76%
Mortgage Type
New Conventional
Purchase Details
Closed on
Apr 11, 2011
Sold by
Dias Lori
Bought by
Dias Lori and Dias John J
Purchase Details
Closed on
Nov 4, 2003
Sold by
Virga Vincent and Virga Gina
Bought by
Dias John and Dias Lori
Home Financials for this Owner
Home Financials are based on the most recent Mortgage that was taken out on this home.
Original Mortgage
$225,000
Interest Rate
6.05%
Mortgage Type
Purchase Money Mortgage
Purchase Details
Closed on
Jul 20, 2000
Sold by
Barnhart Richard and Barnhart Laura
Bought by
Virga Vincent and Virga Gina
Purchase Details
Closed on
Oct 17, 1990
Sold by
Lacava Constr
Bought by
Barnhart Richard
Create a Home Valuation Report for This Property
The Home Valuation Report is an in-depth analysis detailing your home's value as well as a comparison with similar homes in the area
Home Values in the Area
Average Home Value in this Area
Purchase History
| Date | Buyer | Sale Price | Title Company |
|---|---|---|---|
| Peck Kim M | -- | None Available | |
| Peck Kim M | -- | -- | |
| Dias Lori | -- | -- | |
| Dias John | $365,000 | -- | |
| Virga Vincent | $275,000 | -- | |
| Barnhart Richard | $238,500 | -- |
Source: Public Records
Mortgage History
| Date | Status | Borrower | Loan Amount |
|---|---|---|---|
| Previous Owner | Peck Kim M | $315,200 | |
| Previous Owner | Barnhart Richard | $225,000 | |
| Previous Owner | Barnhart Richard | $262,000 |
Source: Public Records
Tax History
| Year | Tax Paid | Tax Assessment Tax Assessment Total Assessment is a certain percentage of the fair market value that is determined by local assessors to be the total taxable value of land and additions on the property. | Land | Improvement |
|---|---|---|---|---|
| 2025 | $10,108 | $272,450 | $64,830 | $207,620 |
| 2024 | $9,808 | $272,450 | $64,830 | $207,620 |
| 2023 | $9,345 | $272,450 | $64,830 | $207,620 |
| 2022 | $8,855 | $272,450 | $64,830 | $207,620 |
| 2021 | $8,609 | $272,450 | $64,830 | $207,620 |
| 2020 | $9,380 | $287,720 | $64,710 | $223,010 |
| 2019 | $9,380 | $287,720 | $64,710 | $223,010 |
| 2016 | $8,733 | $286,330 | $64,710 | $221,620 |
| 2015 | $8,879 | $291,120 | $64,710 | $226,410 |
| 2014 | $8,355 | $291,120 | $64,710 | $226,410 |
Source: Public Records
Map
Nearby Homes
Your Personal Tour Guide
Ask me questions while you tour the home.