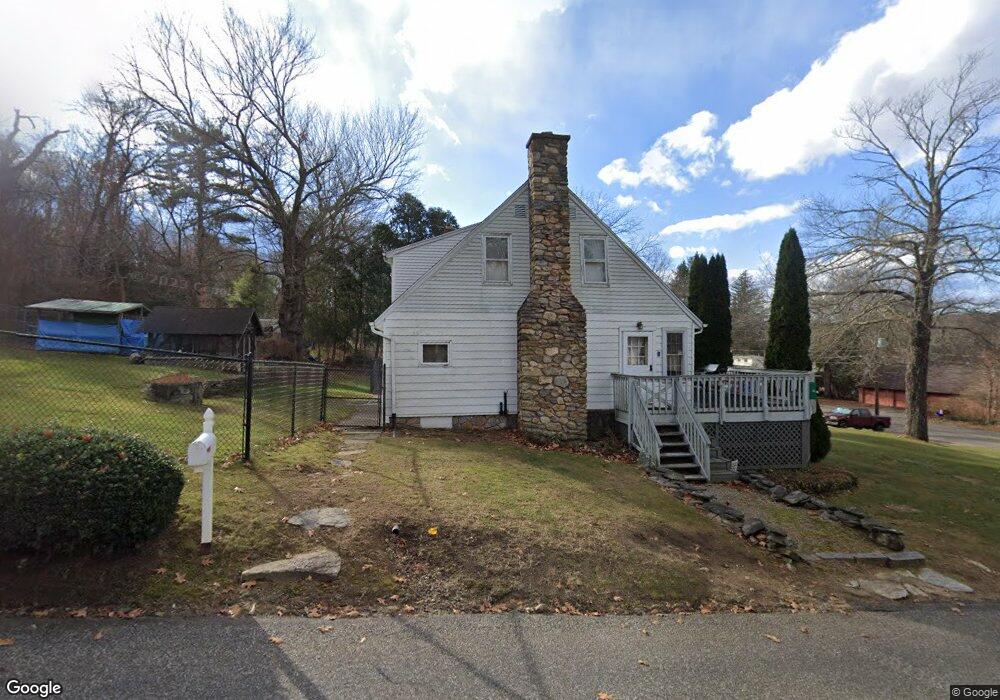
4 West St Andover, CT 06232
Estimated Value: $237,000 - $386,000
4
Beds
2
Baths
1,613
Sq Ft
$200/Sq Ft
Est. Value
About This Home
This home is located at 4 West St, Andover, CT 06232 and is currently estimated at $322,183, approximately $199 per square foot. 4 West St is a home located in Tolland County with nearby schools including Andover Elementary School, RHAM Middle School, and RHAM High School.
Ownership History
Date
Name
Owned For
Owner Type
Purchase Details
Closed on
Mar 21, 2018
Sold by
Department Of Housing & Urban Dev
Bought by
Lablonde Marc
Current Estimated Value
Purchase Details
Closed on
Jan 2, 2018
Sold by
Bank Of America Na
Bought by
Department Of Housing & Urban Dev
Purchase Details
Closed on
Apr 12, 1999
Sold by
Dube Sharon
Bought by
Dube Rene
Purchase Details
Closed on
May 31, 1996
Sold by
Zikus Edward and Zikus Jane
Bought by
Gutkowski Sharon
Create a Home Valuation Report for This Property
The Home Valuation Report is an in-depth analysis detailing your home's value as well as a comparison with similar homes in the area
Home Values in the Area
Average Home Value in this Area
Purchase History
| Date | Buyer | Sale Price | Title Company |
|---|---|---|---|
| Lablonde Marc | $129,112 | -- | |
| Lablonde Marc | $129,112 | -- | |
| Department Of Housing & Urban Dev | -- | -- | |
| Department Of Housing & Urban Dev | -- | -- | |
| Dube Rene | $125,000 | -- | |
| Dube Rene | $125,000 | -- | |
| Gutkowski Sharon | $123,000 | -- | |
| Gutkowski Sharon | $123,000 | -- |
Source: Public Records
Mortgage History
| Date | Status | Borrower | Loan Amount |
|---|---|---|---|
| Previous Owner | Gutkowski Sharon | $113,862 | |
| Previous Owner | Gutkowski Sharon | $274,811 |
Source: Public Records
Tax History
| Year | Tax Paid | Tax Assessment Tax Assessment Total Assessment is a certain percentage of the fair market value that is determined by local assessors to be the total taxable value of land and additions on the property. | Land | Improvement |
|---|---|---|---|---|
| 2025 | $4,314 | $136,570 | $38,570 | $98,000 |
| 2024 | $4,296 | $136,570 | $38,570 | $98,000 |
| 2023 | $4,273 | $136,570 | $38,570 | $98,000 |
| 2022 | $4,358 | $136,570 | $38,570 | $98,000 |
| 2021 | $4,774 | $132,600 | $50,500 | $82,100 |
| 2020 | $4,729 | $132,800 | $50,500 | $82,300 |
| 2019 | $4,647 | $132,800 | $50,500 | $82,300 |
| 2018 | $4,509 | $132,800 | $50,500 | $82,300 |
| 2017 | $4,316 | $132,800 | $50,500 | $82,300 |
| 2016 | $4,086 | $133,000 | $50,500 | $82,500 |
| 2015 | $4,086 | $133,000 | $50,500 | $82,500 |
| 2014 | $4,086 | $133,000 | $50,500 | $82,500 |
Source: Public Records
Map
Nearby Homes
- 10 Lakeview Park
- 13 Basket Shop Rd
- 17 Route 6
- 0 Wheeling Rd Unit 24116879
- 249 Wall St
- 127 U S 6
- 64 Loveland Rd
- 559 East St
- 54 Bissell Ridge Rd
- 869 East St
- 23 Thompson Hill Rd
- 00 Zola Rd
- 35 Ridge Rd
- 273 Hebron Rd
- 2 Summit Rd
- 1 Church St
- 2 Church St
- 0 Skinner Hill Rd Unit 24077239
- 17 Ireland Dr
- 0 Hinkel Mae Dr
Your Personal Tour Guide
Ask me questions while you tour the home.