4 Westerly Rd Westerly, RI 02891
Westerly AreaEstimated Value: $3,398,000 - $10,078,655
About This Home
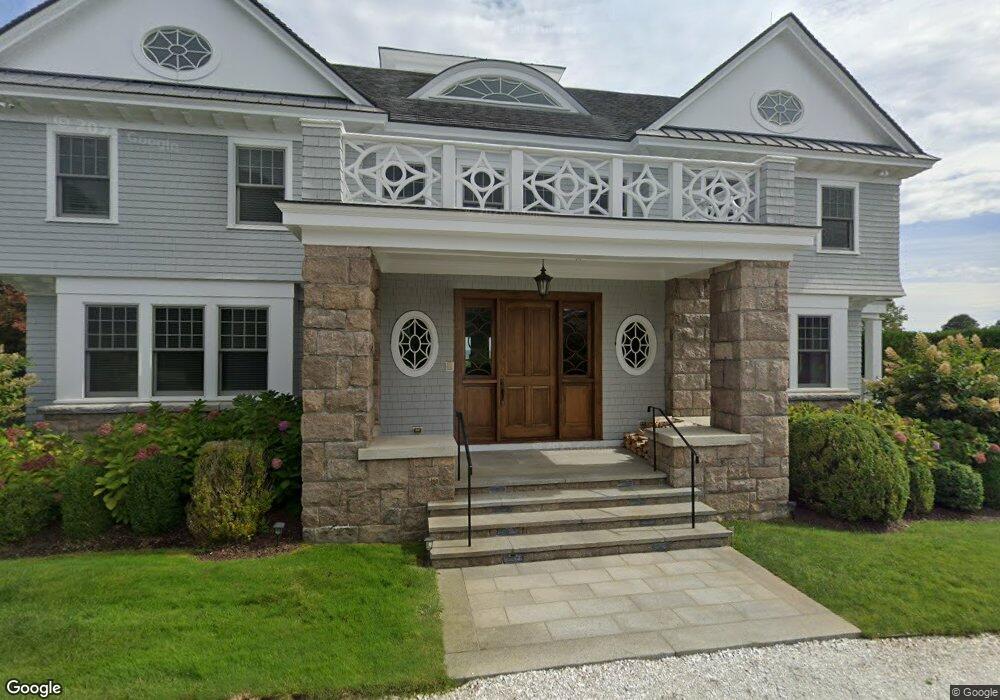
This home is located at 4 Westerly Rd, Westerly, RI 02891 and is currently estimated at $6,738,328, approximately $962 per square foot. 4 Westerly Rd is a home located in Washington County with nearby schools including Westerly High School.
Ownership History
We collect this data history from publicly available records. To have your information removed, we recommend requesting removal directly through your county’s website.
Purchase Details
Purchase Details
Home Values in the Area
Average Home Value in this Area
Purchase History
We collect this data history from publicly available records. To have your information removed, we recommend requesting removal directly through your county’s website.
| Date | Buyer | Sale Price | Title Company |
|---|---|---|---|
| $2,500,000 | -- | ||
| $1,250,000 | -- |
Mortgage History
We collect this data history from publicly available records. To have your information removed, we recommend requesting removal directly through your county’s website.
| Date | Status | Borrower | Loan Amount |
|---|---|---|---|
| Open | $2,800,000 |
Tax History
We collect this data history from publicly available records. To have your information removed, we recommend requesting removal directly through your county’s website.
| Year | Tax Paid | Tax Assessment Tax Assessment Total Assessment is a certain percentage of the fair market value that is determined by local assessors to be the total taxable value of land and additions on the property. | Land | Improvement |
|---|---|---|---|---|
| 2025 | $91,613 | $12,885,100 | $6,883,400 | $6,001,700 |
| 2024 | $82,123 | $8,371,400 | $4,513,200 | $3,858,200 |
| 2023 | $80,533 | $8,371,400 | $4,513,200 | $3,858,200 |
| 2022 | $80,031 | $8,371,400 | $4,513,200 | $3,858,200 |
| 2021 | $89,084 | $7,733,000 | $3,923,800 | $3,809,200 |
| 2020 | $87,460 | $7,733,000 | $3,923,800 | $3,809,200 |
| 2019 | $92,137 | $8,226,500 | $4,156,700 | $4,069,800 |
| 2018 | $85,604 | $7,205,700 | $4,156,700 | $3,049,000 |
| 2017 | $83,514 | $7,205,700 | $4,156,700 | $3,049,000 |
| 2016 | $84,163 | $7,205,700 | $4,156,700 | $3,049,000 |
| 2015 | $76,752 | $7,093,500 | $4,017,200 | $3,076,300 |
| 2014 | $75,475 | $7,093,500 | $4,017,200 | $3,076,300 |
Map
- 1 Bluff Ave Unit 4-1
- 6 Chapel Ln
- 6 Chapel Ln
- 14 Pawcatuck Ave
- 38 Bay St Unit 301
- 4 Arraquat Rd
- 8 Chapel Ln
- 44 Bay St Unit B105/B205
- 4 Foster Cove Rd
- 16 Fort Rd
- 20 Browning Rd
- 8 Pasadena Ave
- 5 Pasadena Ave
- 50 Ocean View Hwy
- 160 Watch Hill Rd
- 111 Avondale Rd
- 17 E Hills Rd
- 26 E Hills Rd
- 6 Fox Run Run
- 4 Quail Run
Ask me questions while you tour the home.