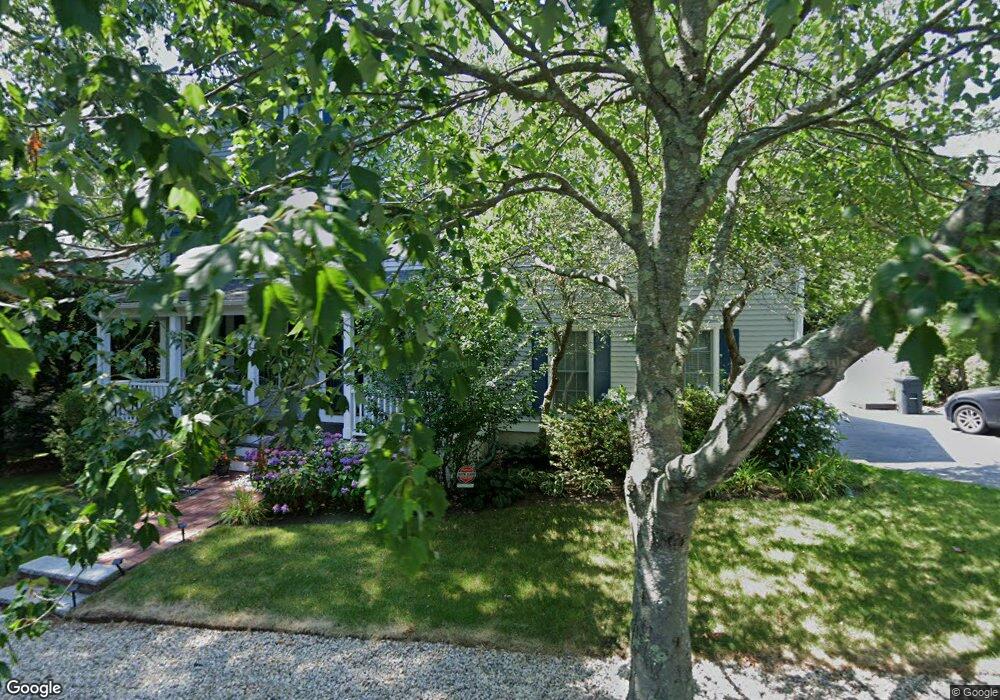
4 Westledge Rd Marblehead, MA 01945
Estimated Value: $1,719,084 - $1,877,000
5
Beds
4
Baths
3,500
Sq Ft
$515/Sq Ft
Est. Value
About This Home
This home is located at 4 Westledge Rd, Marblehead, MA 01945 and is currently estimated at $1,802,021, approximately $514 per square foot. 4 Westledge Rd is a home located in Essex County with nearby schools including Marblehead High School, Marblehead Community Charter Public School, and Tower School.
Ownership History
Date
Name
Owned For
Owner Type
Purchase Details
Closed on
May 5, 2020
Sold by
Thayer James and Thayer Joni
Bought by
Battaglia James and Battaglia Phyoe
Current Estimated Value
Purchase Details
Closed on
Jun 30, 2005
Sold by
Marcus David F and Marcus Jo A
Bought by
Thayer James E
Home Financials for this Owner
Home Financials are based on the most recent Mortgage that was taken out on this home.
Original Mortgage
$890,000
Interest Rate
5.73%
Mortgage Type
Purchase Money Mortgage
Purchase Details
Closed on
Jan 14, 2000
Sold by
Kelly Patrick J
Bought by
Marcus David F and Marcus Jo A
Purchase Details
Closed on
Jun 30, 1999
Sold by
Westledge Corp
Bought by
Kelly Patrick J
Create a Home Valuation Report for This Property
The Home Valuation Report is an in-depth analysis detailing your home's value as well as a comparison with similar homes in the area
Home Values in the Area
Average Home Value in this Area
Purchase History
| Date | Buyer | Sale Price | Title Company |
|---|---|---|---|
| Battaglia James | $1,151,000 | None Available | |
| Battaglia James | $1,151,000 | None Available | |
| Thayer James E | $1,112,500 | -- | |
| Thayer James E | $1,112,500 | -- | |
| Marcus David F | $695,000 | -- | |
| Marcus David F | $695,000 | -- | |
| Kelly Patrick J | $646,520 | -- | |
| Kelly Patrick J | $646,520 | -- |
Source: Public Records
Mortgage History
| Date | Status | Borrower | Loan Amount |
|---|---|---|---|
| Previous Owner | Kelly Patrick J | $150,000 | |
| Previous Owner | Kelly Patrick J | $890,000 |
Source: Public Records
Tax History
| Year | Tax Paid | Tax Assessment Tax Assessment Total Assessment is a certain percentage of the fair market value that is determined by local assessors to be the total taxable value of land and additions on the property. | Land | Improvement |
|---|---|---|---|---|
| 2025 | $12,915 | $1,427,100 | $861,800 | $565,300 |
| 2024 | $12,311 | $1,374,000 | $888,300 | $485,700 |
| 2023 | $12,418 | $1,241,800 | $769,000 | $472,800 |
| 2022 | $11,399 | $1,083,600 | $623,200 | $460,400 |
| 2021 | $10,738 | $1,030,500 | $570,100 | $460,400 |
| 2020 | $9,939 | $956,600 | $556,900 | $399,700 |
| 2019 | $9,989 | $930,100 | $530,400 | $399,700 |
| 2018 | $10,250 | $930,100 | $530,400 | $399,700 |
| 2017 | $10,240 | $930,100 | $530,400 | $399,700 |
| 2016 | $10,324 | $930,100 | $530,400 | $399,700 |
| 2015 | $10,132 | $914,400 | $490,600 | $423,800 |
| 2014 | $9,010 | $812,400 | $397,800 | $414,600 |
Source: Public Records
Map
Nearby Homes
- 30 Haley Rd Unit 1
- 70 Maverick St
- 1 Knollwood Rd
- 33 W Shore Dr
- 282 Pleasant St
- 6 Mount Vernon St
- 55 Roosevelt Ave
- 290 Washington St Unit A
- 4 Fairview Rd
- 7 Cottage St
- 1 Shore Ave
- 41 Atlantic Ave Unit 1
- 9 Lincoln Park
- 23 Wyman Rd
- 132 Elm St
- 132 Elm St Unit 132
- 29 Ocean Ave Unit 4
- 66 Pleasant St Unit 1
- 66 Pleasant St Unit 2
- 4 Dean Rd
Your Personal Tour Guide
Ask me questions while you tour the home.