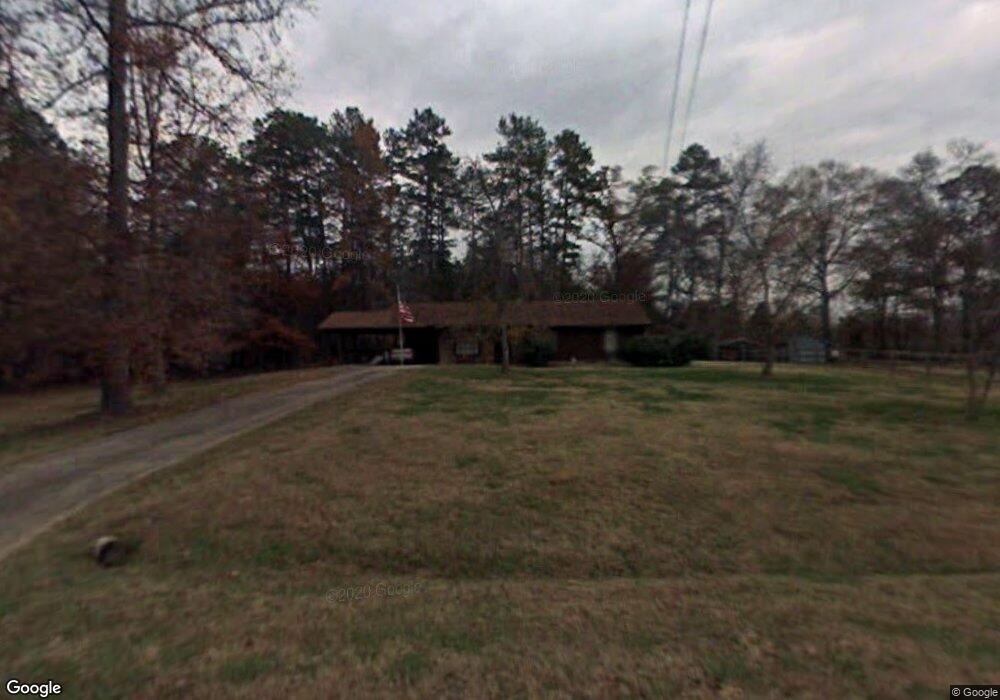
4 Willow Bend Rd NE Unit 49 Armuchee, GA 30105
Estimated Value: $199,000 - $253,000
3
Beds
2
Baths
1,387
Sq Ft
$166/Sq Ft
Est. Value
About This Home
This home is located at 4 Willow Bend Rd NE Unit 49, Armuchee, GA 30105 and is currently estimated at $230,226, approximately $165 per square foot. 4 Willow Bend Rd NE Unit 49 is a home located in Floyd County with nearby schools including Bloomingdale Elementary School, Armuchee Middle School, and Armuchee High School.
Ownership History
Date
Name
Owned For
Owner Type
Purchase Details
Closed on
Oct 19, 2018
Sold by
Mcdaniel Daphne D
Bought by
Wilson Aaron C and Wilson Kaitlyn B
Current Estimated Value
Home Financials for this Owner
Home Financials are based on the most recent Mortgage that was taken out on this home.
Original Mortgage
$128,000
Outstanding Balance
$111,861
Interest Rate
4.6%
Estimated Equity
$118,365
Purchase Details
Closed on
Mar 15, 2013
Sold by
Holte Jill Marie Forrester
Bought by
Mcdaniel Daphne D
Home Financials for this Owner
Home Financials are based on the most recent Mortgage that was taken out on this home.
Original Mortgage
$86,734
Interest Rate
3.57%
Mortgage Type
New Conventional
Purchase Details
Closed on
Mar 5, 2012
Sold by
Holte Jill Forrester
Bought by
Fleming Mary
Purchase Details
Closed on
Dec 2, 2008
Sold by
Fleming Mary
Bought by
Forrester Lana
Purchase Details
Closed on
Aug 7, 1989
Sold by
Lanier David A and Lanier Debbie C
Bought by
Fleming Russell E and Fleming Mary
Purchase Details
Closed on
Apr 25, 1983
Sold by
Burk William Builders Inc
Bought by
Lanier David A and Lanier Debbie C
Purchase Details
Closed on
May 4, 1979
Bought by
Burk William Builders Inc
Create a Home Valuation Report for This Property
The Home Valuation Report is an in-depth analysis detailing your home's value as well as a comparison with similar homes in the area
Home Values in the Area
Average Home Value in this Area
Purchase History
| Date | Buyer | Sale Price | Title Company |
|---|---|---|---|
| Wilson Aaron C | $125,000 | -- | |
| Mcdaniel Daphne D | $85,000 | -- | |
| Fleming Mary | -- | -- | |
| Forrester Lana | -- | -- | |
| Fleming Russell E | $57,500 | -- | |
| Lanier David A | -- | -- | |
| Burk William Builders Inc | -- | -- |
Source: Public Records
Mortgage History
| Date | Status | Borrower | Loan Amount |
|---|---|---|---|
| Open | Wilson Aaron C | $128,000 | |
| Previous Owner | Mcdaniel Daphne D | $86,734 |
Source: Public Records
Tax History Compared to Growth
Tax History
| Year | Tax Paid | Tax Assessment Tax Assessment Total Assessment is a certain percentage of the fair market value that is determined by local assessors to be the total taxable value of land and additions on the property. | Land | Improvement |
|---|---|---|---|---|
| 2024 | $1,742 | $74,484 | $20,988 | $53,496 |
| 2023 | $1,627 | $66,084 | $19,080 | $47,004 |
| 2022 | $1,457 | $54,223 | $13,738 | $40,485 |
| 2021 | $1,350 | $47,661 | $13,738 | $33,923 |
| 2020 | $1,268 | $43,009 | $10,303 | $32,706 |
| 2019 | $1,131 | $36,713 | $10,303 | $26,410 |
| 2018 | $1,190 | $35,605 | $10,303 | $25,302 |
| 2017 | $1,177 | $35,080 | $10,303 | $24,777 |
| 2016 | $1,182 | $34,768 | $10,280 | $24,488 |
| 2015 | $1,404 | $35,128 | $10,280 | $24,848 |
| 2014 | $1,404 | $42,906 | $10,280 | $32,626 |
Source: Public Records
Map
Nearby Homes
- 1024 New Rosedale Rd NE
- 1085 New Rosedale Rd NE
- 1194 New Rosedale Rd NE
- 1603 Floyd Springs Rd NE
- 311 Herring Rd NE
- 46 North Dr
- 1465 Turner Rd NE
- 0 Highway 140 Unit 20164671
- 201 Kellett Rd NE
- 70 Old Summerville Rd
- 2888 Old Summerville Rd
- 282 Turner Rd NE
- 334 Armuchee Trail NE
- 2324 Floyd Springs Rd NE
- 4494 Old Summerville Rd
- 12 Scenic Trace Dr NW
- 266 W Troutman Rd NE
- 0 Big Texas Valley Rd NW Unit 10420220
- 00 Westvalley Dr
- 0 Westvalley Dr NW Unit 10633217
- 4 Willow Bend Rd NE
- 2 Willow Bend Rd NE
- 7 Willow Bend Dr NE Unit 46
- 0 Willow Bend Rd Unit 8247422
- 0 Willow Bend Rd Unit 8413454
- 0 Willow Bend Rd Unit 3190979
- 0 Willow Bend Rd
- 5 Willow Bend Rd NE
- 6 Willow Bend Rd NE
- 891 New Rosedale Rd NE
- 7 Willow Bend Rd NE
- 8 Willow Bend Rd NE
- 9 Willow Bend Rd NE
- 870 New Rosedale Rd NE
- 26 Southern Woods Dr NE
- 24 Southern Woods Dr NE
- 22 Southern Woods Dr NE
- 20 Southern Woods Dr NE
- 28 Southern Woods Dr NE
- 30 Southern Woods Dr NE