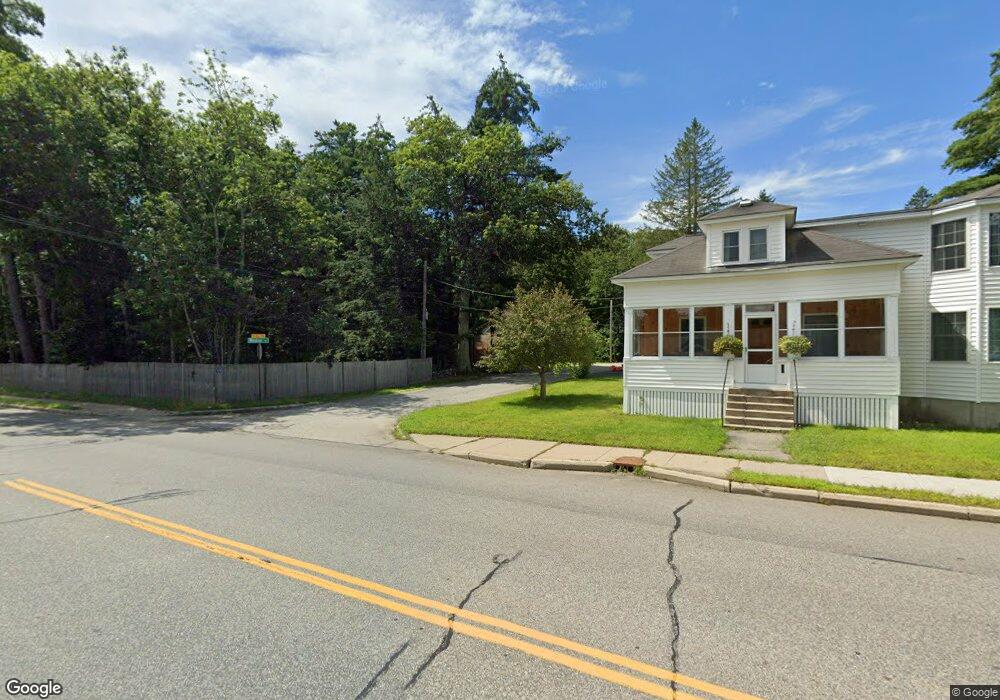
4 Winsor Sanford, ME 04083
Estimated Value: $338,000 - $375,000
2
Beds
2
Baths
972
Sq Ft
$365/Sq Ft
Est. Value
About This Home
This home is located at 4 Winsor, Sanford, ME 04083 and is currently estimated at $354,857, approximately $365 per square foot. 4 Winsor is a home located in York County with nearby schools including St Thomas Consolidated School and Sanford Christian Academy.
Ownership History
Date
Name
Owned For
Owner Type
Purchase Details
Closed on
Oct 8, 2021
Sold by
Pepin Raymond A
Bought by
Morris Katie J and Soule Rachel K
Current Estimated Value
Home Financials for this Owner
Home Financials are based on the most recent Mortgage that was taken out on this home.
Original Mortgage
$240,562
Outstanding Balance
$218,416
Interest Rate
2.8%
Mortgage Type
FHA
Estimated Equity
$136,441
Purchase Details
Closed on
Sep 5, 2013
Sold by
Mcwhirk Michael F and Mcwhirk Tabetha M
Bought by
Pepin Raymond A
Home Financials for this Owner
Home Financials are based on the most recent Mortgage that was taken out on this home.
Original Mortgage
$96,153
Interest Rate
4.34%
Mortgage Type
FHA
Purchase Details
Closed on
Mar 7, 2007
Sold by
Ambler-Cote Anne and Cote Stephen E
Bought by
Leach Tabetha M and Mcwhirk 2Nd Michael F
Home Financials for this Owner
Home Financials are based on the most recent Mortgage that was taken out on this home.
Original Mortgage
$188,083
Interest Rate
6.3%
Mortgage Type
FHA
Create a Home Valuation Report for This Property
The Home Valuation Report is an in-depth analysis detailing your home's value as well as a comparison with similar homes in the area
Home Values in the Area
Average Home Value in this Area
Purchase History
| Date | Buyer | Sale Price | Title Company |
|---|---|---|---|
| Morris Katie J | -- | Misc Company | |
| Morris Katie J | -- | Misc Company | |
| Pepin Raymond A | -- | -- | |
| Pepin Raymond A | -- | -- | |
| Leach Tabetha M | -- | -- | |
| Leach Tabetha M | -- | -- |
Source: Public Records
Mortgage History
| Date | Status | Borrower | Loan Amount |
|---|---|---|---|
| Open | Morris Katie J | $240,562 | |
| Previous Owner | Pepin Raymond A | $96,153 | |
| Previous Owner | Leach Tabetha M | $187,952 | |
| Previous Owner | Leach Tabetha M | $188,083 |
Source: Public Records
Tax History Compared to Growth
Tax History
| Year | Tax Paid | Tax Assessment Tax Assessment Total Assessment is a certain percentage of the fair market value that is determined by local assessors to be the total taxable value of land and additions on the property. | Land | Improvement |
|---|---|---|---|---|
| 2025 | $4,342 | $253,900 | $47,400 | $206,500 |
| 2024 | $4,098 | $253,900 | $47,400 | $206,500 |
| 2023 | $3,814 | $251,900 | $47,400 | $204,500 |
| 2022 | $3,728 | $251,900 | $47,400 | $204,500 |
| 2021 | $3,325 | $182,900 | $47,400 | $135,500 |
| 2020 | $3,226 | $160,000 | $47,400 | $112,600 |
| 2019 | $3,117 | $150,600 | $47,400 | $103,200 |
| 2018 | $2,981 | $145,400 | $47,400 | $98,000 |
| 2017 | $2,887 | $139,200 | $47,400 | $91,800 |
| 2016 | $2,963 | $130,300 | $47,400 | $82,900 |
| 2015 | $2,905 | $141,800 | $56,900 | $84,900 |
| 2014 | $3,113 | $144,000 | $59,100 | $84,900 |
| 2013 | -- | $144,000 | $59,100 | $84,900 |
Source: Public Records
Map
Nearby Homes