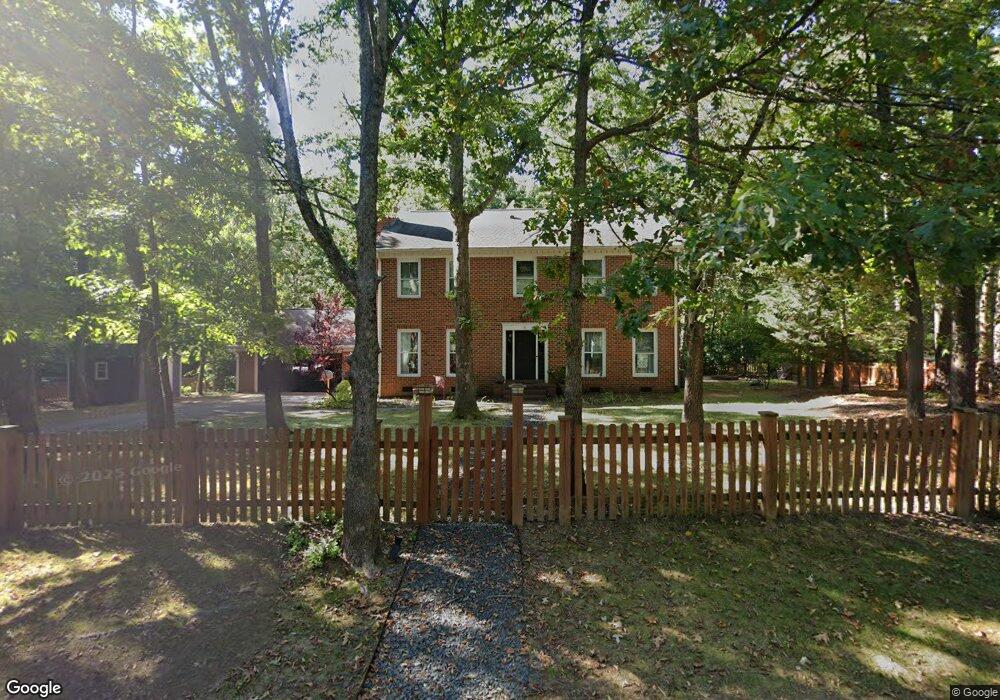
4 Womble Cir Durham, NC 27705
Duke Forest NeighborhoodEstimated Value: $730,507 - $1,005,000
4
Beds
3
Baths
2,884
Sq Ft
$309/Sq Ft
Est. Value
About This Home
This home is located at 4 Womble Cir, Durham, NC 27705 and is currently estimated at $890,127, approximately $308 per square foot. 4 Womble Cir is a home located in Durham County with nearby schools including Lakewood Elementary School, Morehead Montessori, and Lakewood Montessori Middle School.
Ownership History
Date
Name
Owned For
Owner Type
Purchase Details
Closed on
Mar 4, 2020
Sold by
Mitchell Dean S and Mitchell Jessica B
Bought by
Carlson Laura Macaulay and Carlson David Edwin
Current Estimated Value
Home Financials for this Owner
Home Financials are based on the most recent Mortgage that was taken out on this home.
Original Mortgage
$551,200
Outstanding Balance
$488,166
Interest Rate
3.5%
Mortgage Type
New Conventional
Estimated Equity
$401,961
Purchase Details
Closed on
Jun 22, 2015
Sold by
Duke University
Bought by
Mitchell Dean S and Mitchell Jessica B
Purchase Details
Closed on
Sep 9, 2008
Sold by
Fine Wendy
Bought by
Duke University
Purchase Details
Closed on
May 19, 2006
Sold by
Jackson Annette M and Jackson Anthony L
Bought by
Fine Wendy
Home Financials for this Owner
Home Financials are based on the most recent Mortgage that was taken out on this home.
Original Mortgage
$337,200
Interest Rate
6%
Mortgage Type
Fannie Mae Freddie Mac
Create a Home Valuation Report for This Property
The Home Valuation Report is an in-depth analysis detailing your home's value as well as a comparison with similar homes in the area
Home Values in the Area
Average Home Value in this Area
Purchase History
| Date | Buyer | Sale Price | Title Company |
|---|---|---|---|
| Carlson Laura Macaulay | $689,000 | None Available | |
| Mitchell Dean S | $400,000 | Attorney | |
| Duke University | $465,000 | None Available | |
| Fine Wendy | $422,000 | None Available |
Source: Public Records
Mortgage History
| Date | Status | Borrower | Loan Amount |
|---|---|---|---|
| Open | Carlson Laura Macaulay | $551,200 | |
| Previous Owner | Fine Wendy | $337,200 |
Source: Public Records
Tax History
| Year | Tax Paid | Tax Assessment Tax Assessment Total Assessment is a certain percentage of the fair market value that is determined by local assessors to be the total taxable value of land and additions on the property. | Land | Improvement |
|---|---|---|---|---|
| 2025 | $6,019 | $607,225 | $246,675 | $360,550 |
| 2024 | $7,058 | $505,988 | $107,550 | $398,438 |
| 2023 | $6,628 | $505,988 | $107,550 | $398,438 |
| 2022 | $6,476 | $505,988 | $107,550 | $398,438 |
| 2021 | $6,446 | $505,988 | $107,550 | $398,438 |
| 2020 | $6,294 | $505,988 | $107,550 | $398,438 |
| 2019 | $6,294 | $505,988 | $107,550 | $398,438 |
| 2018 | $5,977 | $440,647 | $71,700 | $368,947 |
| 2017 | $5,933 | $440,647 | $71,700 | $368,947 |
| 2016 | $5,823 | $447,509 | $71,700 | $375,809 |
| 2015 | $5,565 | $402,027 | $70,296 | $331,731 |
| 2014 | -- | $402,027 | $70,296 | $331,731 |
Source: Public Records
Map
Nearby Homes
- 2734 Spencer St
- 4 Harvey Place
- 2810 Montcastle Ct
- 2502 Sevier St
- 2822 Pickett Rd Unit 154
- 13 Creekview Ln
- 18 Marchmont Ct
- 16 Marchmont Ct
- 2201 W Cornwallis Rd Unit 2b-2
- 2201 W Cornwallis Rd Unit 1b-1
- 2201 W Cornwallis Rd Unit 2b-3.1
- 2201 W Cornwallis Rd Unit 1b-3
- 2201 W Cornwallis Rd Unit 2b-3
- 2201 W Cornwallis Rd Unit 2b-4
- 2201 W Cornwallis Rd Unit 2b-2.1
- 2201 W Cornwallis Rd Unit 1b-2
- 2201 W Cornwallis Rd Unit 2b-1
- 53 Stoneridge Rd
- 3080 Colony Rd Unit 3080c
- 101 Pinecrest Rd
- 2814 Montgomery St
- 2900 Montgomery St
- 2813 Montgomery St
- 2819 Montgomery St
- 2810 Montgomery St
- 12 Upchurch Cir
- 9 Womble Cir
- 15 Upchurch Cir
- 2807 Montgomery St
- 2906 Montgomery St
- 10 Upchurch Cir
- 2808 Montgomery St
- 11 Upchurch Cir
- 8 Upchurch Cir
- 1714 Tisdale St
- 2907 Montgomery St
- 2804 Montgomery St
- 1720 Tisdale St
- 1724 Tisdale St
- 1728 Tisdale St
Your Personal Tour Guide
Ask me questions while you tour the home.