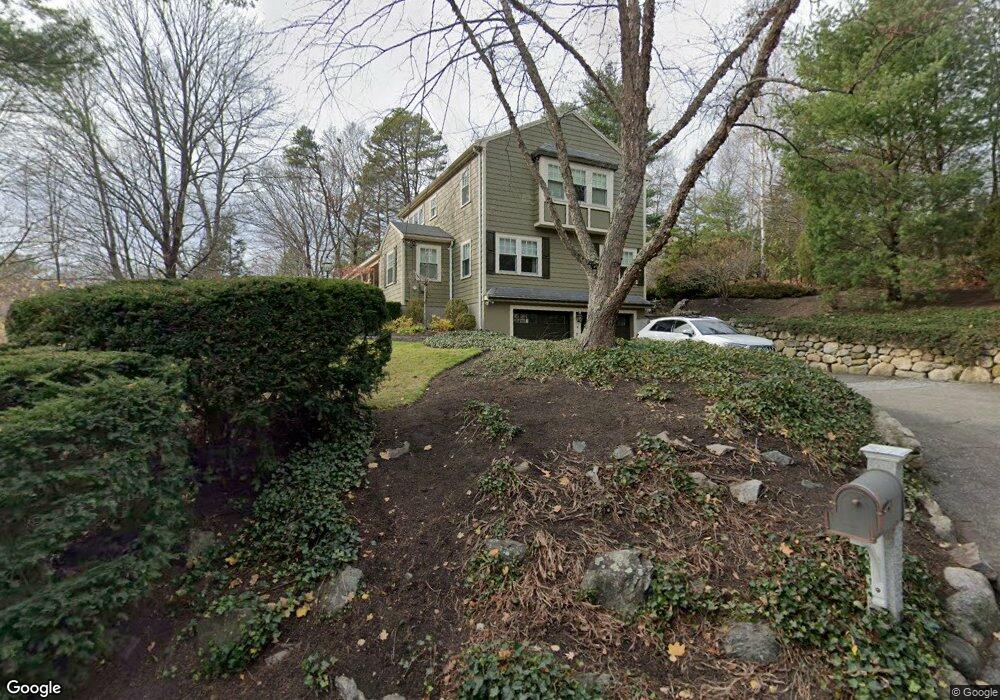
4 Wood Ln Winchester, MA 01890
Estimated Value: $1,942,000 - $2,280,000
4
Beds
4
Baths
3,697
Sq Ft
$580/Sq Ft
Est. Value
About This Home
This home is located at 4 Wood Ln, Winchester, MA 01890 and is currently estimated at $2,143,451, approximately $579 per square foot. 4 Wood Ln is a home located in Middlesex County with nearby schools including Ambrose Elementary School, McCall Middle School, and Winchester High School.
Ownership History
Date
Name
Owned For
Owner Type
Purchase Details
Closed on
Jun 3, 2024
Sold by
Tully Dana M and Tully Mark E
Bought by
Tully Dana M
Current Estimated Value
Purchase Details
Closed on
May 24, 2000
Sold by
Smith Charles L
Bought by
Mcalister Dana L and Tully Mark E
Home Financials for this Owner
Home Financials are based on the most recent Mortgage that was taken out on this home.
Original Mortgage
$637,200
Interest Rate
8.1%
Mortgage Type
Purchase Money Mortgage
Purchase Details
Closed on
Jun 19, 1998
Sold by
Curtin Robert T and Curtin Diane B
Bought by
Smith Charles L
Purchase Details
Closed on
Aug 30, 1995
Sold by
Crocker Ralph W
Bought by
Curtin Robert T and Curtin Diane B
Home Financials for this Owner
Home Financials are based on the most recent Mortgage that was taken out on this home.
Original Mortgage
$170,000
Interest Rate
7.61%
Mortgage Type
Purchase Money Mortgage
Create a Home Valuation Report for This Property
The Home Valuation Report is an in-depth analysis detailing your home's value as well as a comparison with similar homes in the area
Home Values in the Area
Average Home Value in this Area
Purchase History
| Date | Buyer | Sale Price | Title Company |
|---|---|---|---|
| Tully Dana M | -- | None Available | |
| Tully Dana M | -- | None Available | |
| Mcalister Dana L | $796,500 | -- | |
| Smith Charles L | $489,000 | -- | |
| Curtin Robert T | $370,000 | -- |
Source: Public Records
Mortgage History
| Date | Status | Borrower | Loan Amount |
|---|---|---|---|
| Previous Owner | Curtin Robert T | $2,000,000 | |
| Previous Owner | Curtin Robert T | $637,200 | |
| Previous Owner | Curtin Robert T | $170,000 |
Source: Public Records
Tax History Compared to Growth
Tax History
| Year | Tax Paid | Tax Assessment Tax Assessment Total Assessment is a certain percentage of the fair market value that is determined by local assessors to be the total taxable value of land and additions on the property. | Land | Improvement |
|---|---|---|---|---|
| 2025 | $200 | $1,802,800 | $1,236,300 | $566,500 |
| 2024 | $19,935 | $1,759,500 | $1,236,300 | $523,200 |
| 2023 | $19,702 | $1,669,700 | $1,161,300 | $508,400 |
| 2022 | $19,143 | $1,530,200 | $1,048,900 | $481,300 |
| 2021 | $6,847 | $1,399,100 | $917,800 | $481,300 |
| 2020 | $8,240 | $1,399,100 | $917,800 | $481,300 |
| 2019 | $15,922 | $1,314,800 | $833,500 | $481,300 |
| 2018 | $14,264 | $1,286,400 | $818,600 | $467,800 |
| 2017 | $6,631 | $1,259,300 | $818,600 | $440,700 |
| 2016 | $14,550 | $1,245,700 | $818,600 | $427,100 |
| 2015 | $14,016 | $1,154,500 | $743,600 | $410,900 |
| 2014 | $13,591 | $1,073,500 | $676,200 | $397,300 |
Source: Public Records
Map
Nearby Homes