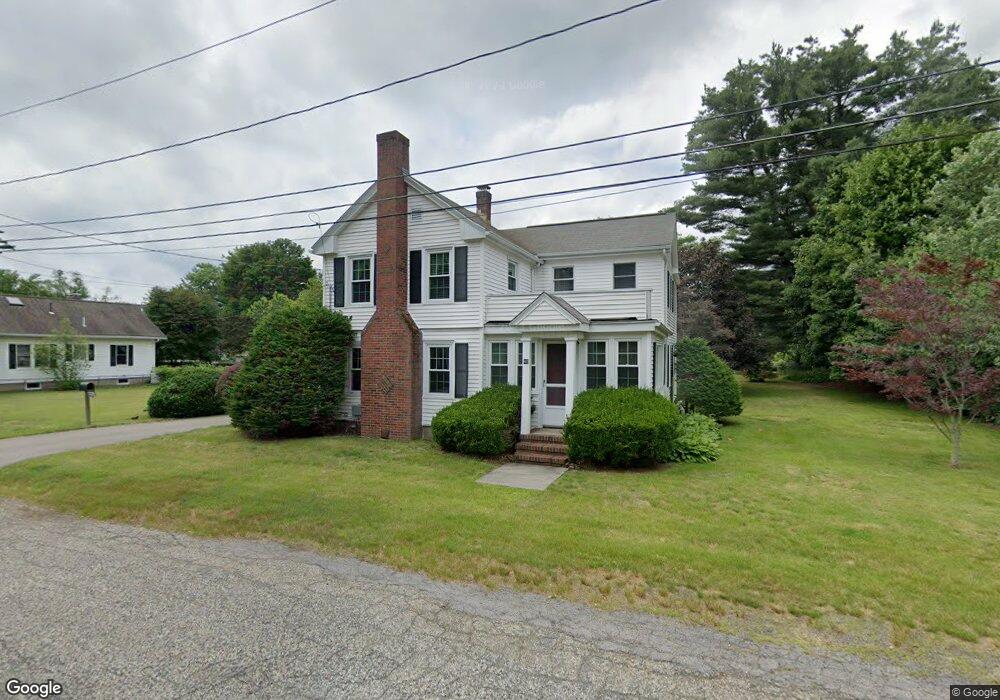
40 2nd St Natick, MA 01760
Estimated Value: $878,000 - $990,000
3
Beds
2
Baths
1,783
Sq Ft
$528/Sq Ft
Est. Value
About This Home
This home is located at 40 2nd St, Natick, MA 01760 and is currently estimated at $942,310, approximately $528 per square foot. 40 2nd St is a home located in Middlesex County with nearby schools including Natick High School, Wilson Middle School, and Bennett-Hemenway (Ben-Hem) Elementary School.
Ownership History
Date
Name
Owned For
Owner Type
Purchase Details
Closed on
Sep 1, 2017
Sold by
Fitzpatrick Marilyn E and Fitzpatrick Susan
Bought by
Fitzpatrick Susan
Current Estimated Value
Purchase Details
Closed on
Dec 4, 2014
Sold by
Fitzpatrick Marilyn E and Fitzpatrick Brian J
Bought by
Fitzpatrick Susan and Fitzpatrick Marilyn E
Purchase Details
Closed on
Dec 8, 2006
Sold by
Fitzpatrick Brian J and Litowsky Amy
Bought by
Fitzpatrick James B
Create a Home Valuation Report for This Property
The Home Valuation Report is an in-depth analysis detailing your home's value as well as a comparison with similar homes in the area
Home Values in the Area
Average Home Value in this Area
Purchase History
| Date | Buyer | Sale Price | Title Company |
|---|---|---|---|
| Fitzpatrick Susan | -- | -- | |
| Fitzpatrick Susan | -- | -- | |
| Fitzpatrick James B | -- | -- |
Source: Public Records
Tax History Compared to Growth
Tax History
| Year | Tax Paid | Tax Assessment Tax Assessment Total Assessment is a certain percentage of the fair market value that is determined by local assessors to be the total taxable value of land and additions on the property. | Land | Improvement |
|---|---|---|---|---|
| 2025 | $9,591 | $801,900 | $459,900 | $342,000 |
| 2024 | $9,233 | $753,100 | $432,800 | $320,300 |
| 2023 | $9,117 | $721,300 | $413,400 | $307,900 |
| 2022 | $8,634 | $647,200 | $373,000 | $274,200 |
| 2021 | $8,299 | $609,800 | $351,700 | $258,100 |
| 2020 | $8,082 | $593,800 | $335,700 | $258,100 |
| 2019 | $7,547 | $593,800 | $335,700 | $258,100 |
| 2018 | $1,769 | $554,000 | $319,700 | $234,300 |
| 2017 | $6,875 | $509,600 | $279,600 | $230,000 |
| 2016 | $6,603 | $486,600 | $258,600 | $228,000 |
| 2015 | $6,462 | $467,600 | $258,600 | $209,000 |
Source: Public Records
Map
Nearby Homes