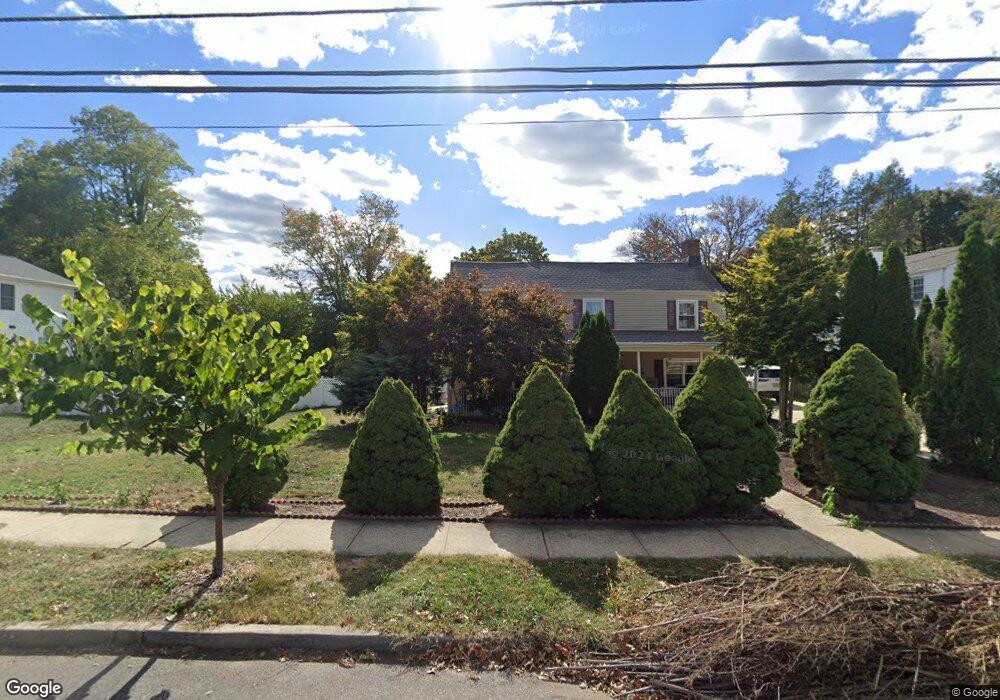
40-42 Hull Ave Freehold, NJ 07728
Estimated Value: $558,000 - $636,000
3
Beds
2
Baths
1,954
Sq Ft
$302/Sq Ft
Est. Value
About This Home
This home is located at 40-42 Hull Ave, Freehold, NJ 07728 and is currently estimated at $590,402, approximately $302 per square foot. 40-42 Hull Ave is a home located in Monmouth County with nearby schools including Park Avenue Elementary School, Freehold Intermediate School, and Freehold Borough High School.
Ownership History
Date
Name
Owned For
Owner Type
Purchase Details
Closed on
May 20, 2013
Sold by
Ramirez Avelino and Beltre Periangilly
Bought by
Chen Bao Zhen
Current Estimated Value
Purchase Details
Closed on
Dec 6, 2005
Sold by
Schwartz Eugene
Bought by
Ramirez Avelino and Beltre Periangilly
Home Financials for this Owner
Home Financials are based on the most recent Mortgage that was taken out on this home.
Original Mortgage
$284,000
Interest Rate
6.33%
Purchase Details
Closed on
Feb 1, 2001
Sold by
Covian Carlos
Bought by
Begum Akbari and Begum Askari
Purchase Details
Closed on
Aug 31, 1999
Sold by
Mundy Michael
Bought by
Covian Carlos
Home Financials for this Owner
Home Financials are based on the most recent Mortgage that was taken out on this home.
Original Mortgage
$80,750
Interest Rate
7.8%
Create a Home Valuation Report for This Property
The Home Valuation Report is an in-depth analysis detailing your home's value as well as a comparison with similar homes in the area
Home Values in the Area
Average Home Value in this Area
Purchase History
| Date | Buyer | Sale Price | Title Company |
|---|---|---|---|
| Chen Bao Zhen | $170,000 | None Available | |
| Ramirez Avelino | $355,000 | -- | |
| Begum Akbari | $150,000 | -- | |
| Covian Carlos | $85,000 | -- |
Source: Public Records
Mortgage History
| Date | Status | Borrower | Loan Amount |
|---|---|---|---|
| Previous Owner | Ramirez Avelino | $284,000 | |
| Previous Owner | Covian Carlos | $80,750 |
Source: Public Records
Tax History Compared to Growth
Tax History
| Year | Tax Paid | Tax Assessment Tax Assessment Total Assessment is a certain percentage of the fair market value that is determined by local assessors to be the total taxable value of land and additions on the property. | Land | Improvement |
|---|---|---|---|---|
| 2025 | $9,471 | $532,800 | $294,600 | $238,200 |
| 2024 | $10,129 | $471,900 | $238,100 | $233,800 |
| 2023 | $10,129 | $483,000 | $247,500 | $235,500 |
| 2022 | $8,994 | $392,000 | $177,600 | $214,400 |
| 2021 | $8,994 | $342,900 | $148,000 | $194,900 |
| 2020 | $8,888 | $333,900 | $148,000 | $185,900 |
| 2019 | $8,700 | $328,300 | $148,000 | $180,300 |
| 2018 | $8,776 | $324,900 | $148,000 | $176,900 |
| 2017 | $8,749 | $322,600 | $148,000 | $174,600 |
| 2016 | $8,926 | $336,200 | $165,000 | $171,200 |
| 2015 | $8,773 | $346,200 | $175,000 | $171,200 |
| 2014 | $8,375 | $346,200 | $175,000 | $171,200 |
Source: Public Records
Map
Nearby Homes
- 42 Hull Ave
- 44 Hull Ave
- 38 Hull Ave
- 46 Hull Ave
- 35 Hull Ave
- 41 Hull Ave
- 48 Hull Ave
- 13 Cottage Place
- 47 Brinckerhoff Ave
- 45 Brinckerhoff Ave
- 49 Brinckerhoff Ave
- 20-36 Hull Ave
- 20 Hull Ave
- 11 Cottage Place
- 43 Brinckerhoff Ave
- 50 Hull Ave
- 51 Brinckerhoff Ave
- 41 Brinckerhoff Ave
- 9 Cottage Place
- 54 Hull Ave