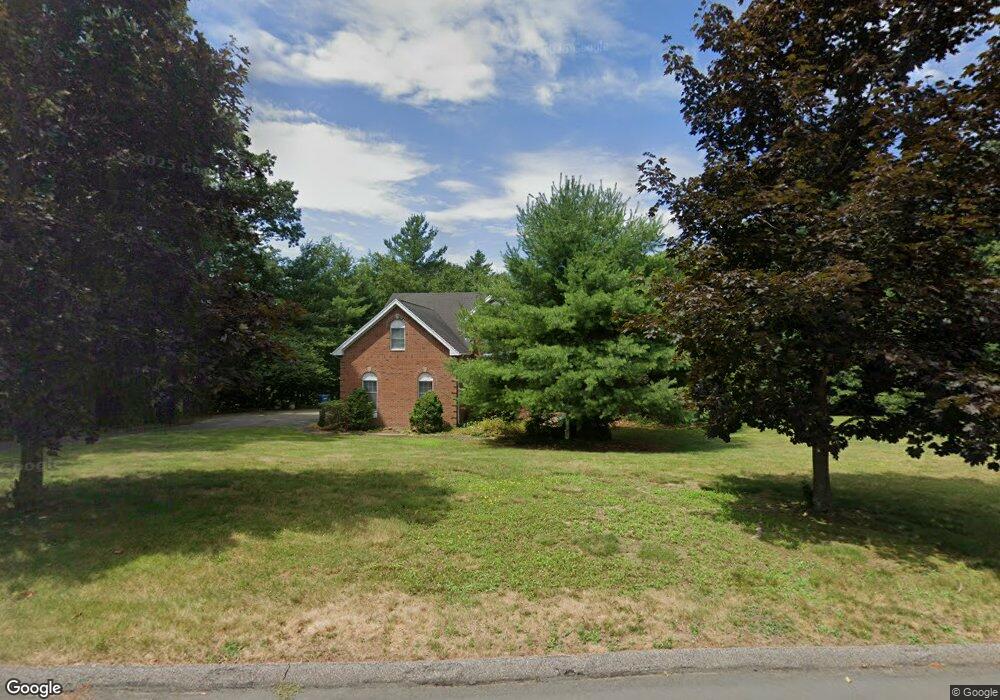
40 Aldrich Rd Canton, MA 02021
Estimated Value: $1,395,167 - $1,686,000
5
Beds
4
Baths
5,000
Sq Ft
$305/Sq Ft
Est. Value
About This Home
This home is located at 40 Aldrich Rd, Canton, MA 02021 and is currently estimated at $1,524,792, approximately $304 per square foot. 40 Aldrich Rd is a home located in Norfolk County with nearby schools including Canton High School.
Ownership History
Date
Name
Owned For
Owner Type
Purchase Details
Closed on
Jun 12, 2009
Sold by
Khabbaz Camil J and Khabbaz Amalia
Bought by
Heidle Hans G and Heidle Wendy N
Current Estimated Value
Home Financials for this Owner
Home Financials are based on the most recent Mortgage that was taken out on this home.
Original Mortgage
$417,000
Interest Rate
4.82%
Mortgage Type
Purchase Money Mortgage
Purchase Details
Closed on
Jul 3, 2000
Sold by
Kim Jacob J and Kim Milee
Bought by
Khabbaz Camil
Home Financials for this Owner
Home Financials are based on the most recent Mortgage that was taken out on this home.
Original Mortgage
$378,000
Interest Rate
8.59%
Mortgage Type
Purchase Money Mortgage
Purchase Details
Closed on
Nov 6, 1997
Sold by
Eagle Farm Lp
Bought by
Kim Jacob J and Kim Milee
Purchase Details
Closed on
Jun 11, 1997
Sold by
Barletta Co Inc
Bought by
Eagle Farm Lp
Create a Home Valuation Report for This Property
The Home Valuation Report is an in-depth analysis detailing your home's value as well as a comparison with similar homes in the area
Home Values in the Area
Average Home Value in this Area
Purchase History
| Date | Buyer | Sale Price | Title Company |
|---|---|---|---|
| Heidle Hans G | $710,000 | -- | |
| Khabbaz Camil | $546,665 | -- | |
| Kim Jacob J | $421,570 | -- | |
| Eagle Farm Lp | $132,000 | -- |
Source: Public Records
Mortgage History
| Date | Status | Borrower | Loan Amount |
|---|---|---|---|
| Open | Eagle Farm Lp | $562,500 | |
| Closed | Heidle Hans G | $417,000 | |
| Previous Owner | Eagle Farm Lp | $435,000 | |
| Previous Owner | Eagle Farm Lp | $378,000 |
Source: Public Records
Tax History
| Year | Tax Paid | Tax Assessment Tax Assessment Total Assessment is a certain percentage of the fair market value that is determined by local assessors to be the total taxable value of land and additions on the property. | Land | Improvement |
|---|---|---|---|---|
| 2025 | $12,193 | $1,232,900 | $363,600 | $869,300 |
| 2024 | $11,932 | $1,196,800 | $349,700 | $847,100 |
| 2023 | $11,295 | $1,068,600 | $349,700 | $718,900 |
| 2022 | $11,199 | $986,700 | $333,000 | $653,700 |
| 2021 | $10,978 | $899,800 | $302,700 | $597,100 |
| 2020 | $10,485 | $857,300 | $288,300 | $569,000 |
| 2019 | $10,511 | $847,700 | $262,000 | $585,700 |
| 2018 | $10,499 | $845,300 | $274,800 | $570,500 |
| 2017 | $10,394 | $812,700 | $269,400 | $543,300 |
| 2016 | $10,228 | $799,700 | $262,800 | $536,900 |
| 2015 | $9,977 | $778,200 | $255,200 | $523,000 |
Source: Public Records
Map
Nearby Homes
- 140 York St
- 65 Foundry Ln
- 50 Indian Ln
- 888 Turnpike St
- 25 Edward St
- 6 Washington Dr
- 79 Gold St
- 1 William Morrison Dr
- 1831 Turnpike St
- 902 Irving Rd Unit 902
- 555 Page St Unit 105
- 232 Canton St Unit 308
- 232 Canton St Unit 104
- Lot 43 Pondview Ln
- Lot 2 Pondview Ln
- 0 Washington St Unit 72888098
- 0 Washington St Unit 71897113
- 35 Turnpike St
- 195 High St
- 1904 Washington St
Your Personal Tour Guide
Ask me questions while you tour the home.