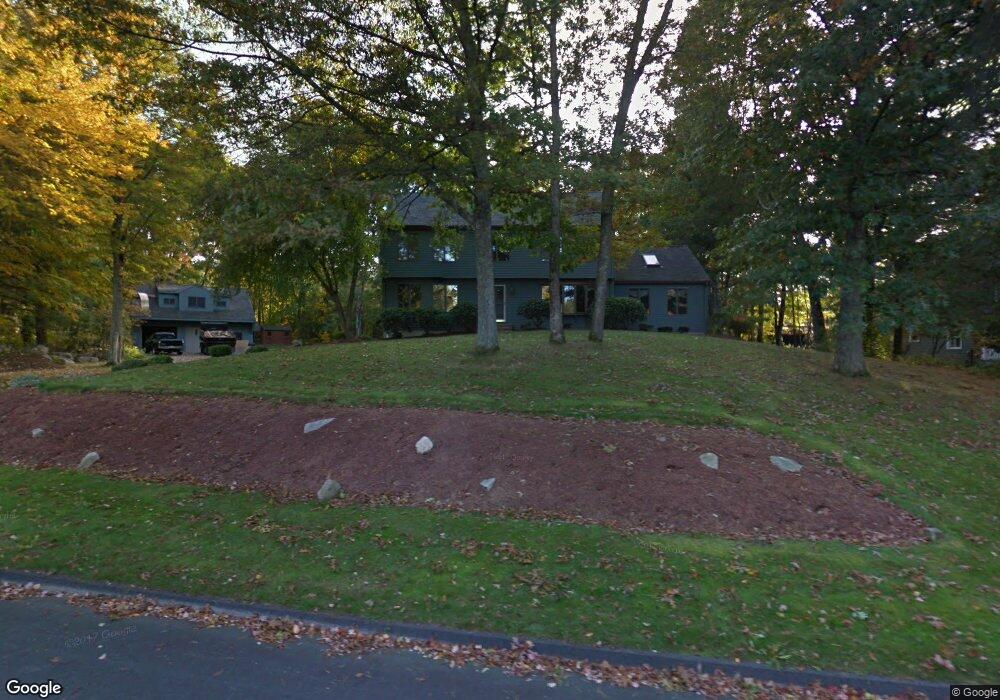
40 Allard Cir Ashland, MA 01721
Estimated Value: $861,000 - $1,011,000
4
Beds
3
Baths
2,682
Sq Ft
$342/Sq Ft
Est. Value
About This Home
This home is located at 40 Allard Cir, Ashland, MA 01721 and is currently estimated at $917,031, approximately $341 per square foot. 40 Allard Cir is a home located in Middlesex County with nearby schools including William Pittaway Elementary School, Henry E. Warren Elementary School, and David Mindess Elementary School.
Ownership History
Date
Name
Owned For
Owner Type
Purchase Details
Closed on
May 31, 2018
Sold by
Cantin Michael L and Cantin Anne M
Bought by
Cantin Ft
Current Estimated Value
Purchase Details
Closed on
Jan 14, 1993
Sold by
Revt George H Todd and Todd George H
Bought by
Cantin Michael L and Cantin Anne M
Create a Home Valuation Report for This Property
The Home Valuation Report is an in-depth analysis detailing your home's value as well as a comparison with similar homes in the area
Home Values in the Area
Average Home Value in this Area
Purchase History
| Date | Buyer | Sale Price | Title Company |
|---|---|---|---|
| Cantin Ft | -- | -- | |
| Cantin Michael L | $18,000 | -- |
Source: Public Records
Mortgage History
| Date | Status | Borrower | Loan Amount |
|---|---|---|---|
| Previous Owner | Cantin Michael L | $35,000 | |
| Previous Owner | Cantin Michael L | $30,000 | |
| Previous Owner | Cantin Michael L | $35,000 |
Source: Public Records
Tax History Compared to Growth
Tax History
| Year | Tax Paid | Tax Assessment Tax Assessment Total Assessment is a certain percentage of the fair market value that is determined by local assessors to be the total taxable value of land and additions on the property. | Land | Improvement |
|---|---|---|---|---|
| 2025 | $11,151 | $873,200 | $286,200 | $587,000 |
| 2024 | $10,805 | $816,100 | $286,200 | $529,900 |
| 2023 | $9,958 | $723,200 | $272,700 | $450,500 |
| 2022 | $10,077 | $634,600 | $247,700 | $386,900 |
| 2021 | $9,587 | $601,800 | $247,700 | $354,100 |
| 2020 | $9,400 | $581,700 | $247,700 | $334,000 |
| 2019 | $9,092 | $558,500 | $247,700 | $310,800 |
| 2018 | $8,979 | $540,600 | $245,400 | $295,200 |
| 2017 | $8,751 | $524,000 | $246,600 | $277,400 |
| 2016 | $8,517 | $501,000 | $243,600 | $257,400 |
| 2015 | $8,375 | $484,100 | $231,600 | $252,500 |
| 2014 | $8,243 | $474,000 | $189,600 | $284,400 |
Source: Public Records
Map
Nearby Homes
- 101 Olive St
- 28-30 Olive St
- 9 Olive St
- 8 Raymond Way
- 11 N Mill St
- 120 Prospect St
- 60 Frankland Rd
- 49 Prospect St
- 10 Clinton St
- 25 Prospect St
- 11 Voyagers Ln
- 638 Main St
- 277 Meeting House Path
- 97 Meeting House Path Unit 97
- 74 Meeting House Path
- 72 Meeting House Path
- 20 Hargrave Ave
- 152 Turner Rd Unit 43
- 152 Turner Rd Unit 14
- 13 Clark St