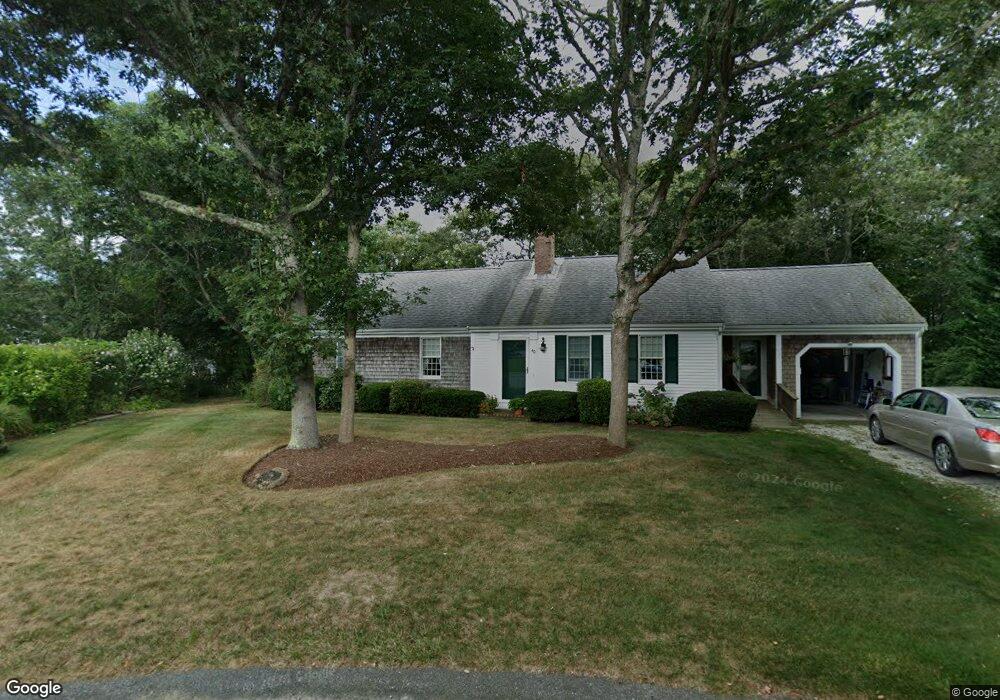
40 Anchorage Ct Harwich Port, MA 02646
Harwich Center NeighborhoodEstimated Value: $757,000 - $890,000
3
Beds
2
Baths
1,438
Sq Ft
$583/Sq Ft
Est. Value
About This Home
This home is located at 40 Anchorage Ct, Harwich Port, MA 02646 and is currently estimated at $837,813, approximately $582 per square foot. 40 Anchorage Ct is a home located in Barnstable County with nearby schools including Harwich Elementary School, Chatham Elementary School, and Monomoy Regional Middle School.
Ownership History
Date
Name
Owned For
Owner Type
Purchase Details
Closed on
Dec 16, 2019
Sold by
Young Sandra P
Bought by
Sandra P Young T
Current Estimated Value
Purchase Details
Closed on
Sep 20, 1991
Sold by
Garden Management Co
Bought by
Young Richard F and Young Sandra P
Home Financials for this Owner
Home Financials are based on the most recent Mortgage that was taken out on this home.
Original Mortgage
$105,500
Interest Rate
9.17%
Mortgage Type
Purchase Money Mortgage
Create a Home Valuation Report for This Property
The Home Valuation Report is an in-depth analysis detailing your home's value as well as a comparison with similar homes in the area
Home Values in the Area
Average Home Value in this Area
Purchase History
| Date | Buyer | Sale Price | Title Company |
|---|---|---|---|
| Sandra P Young T | -- | None Available | |
| Young Richard F | $131,900 | -- | |
| Garden Management Co | $115,000 | -- |
Source: Public Records
Mortgage History
| Date | Status | Borrower | Loan Amount |
|---|---|---|---|
| Previous Owner | Garden Management Co | $105,500 |
Source: Public Records
Tax History Compared to Growth
Tax History
| Year | Tax Paid | Tax Assessment Tax Assessment Total Assessment is a certain percentage of the fair market value that is determined by local assessors to be the total taxable value of land and additions on the property. | Land | Improvement |
|---|---|---|---|---|
| 2025 | $4,327 | $732,100 | $301,000 | $431,100 |
| 2024 | $4,450 | $738,000 | $331,200 | $406,800 |
| 2023 | $4,035 | $607,700 | $258,100 | $349,600 |
| 2022 | $3,856 | $475,500 | $209,500 | $266,000 |
| 2021 | $3,505 | $407,600 | $170,100 | $237,500 |
| 2020 | $3,518 | $403,000 | $169,500 | $233,500 |
| 2019 | $3,299 | $380,500 | $162,900 | $217,600 |
| 2018 | $3,326 | $366,900 | $148,100 | $218,800 |
| 2017 | $3,070 | $342,200 | $135,000 | $207,200 |
| 2016 | $3,001 | $330,900 | $135,000 | $195,900 |
| 2015 | $2,913 | $324,800 | $132,300 | $192,500 |
| 2014 | $2,766 | $315,400 | $128,400 | $187,000 |
Source: Public Records
Map
Nearby Homes
- 106 Chatham Rd
- 28 Dale Rd
- 15 Shannon Rd
- 21 Princes St
- 820 Massachusetts 28
- 44 Beriah Brooks Rd
- 4 Hope Ln
- 27 Quaker Ln
- 42 Marthas Ln
- 53 Freeman St
- 957 Orleans Rd
- 9 Jason Ln
- 116 Parallel St
- 8 Old Wharf Rd
- 6 Marthas Ln
- 11 Windjammer Rd
- 1025 Orleans-Harwich Rd
- 1011 Massachusetts 28 Unit C-6
- 1011 Route 28 Unit 6
- 15 Pleasant St Unit W24