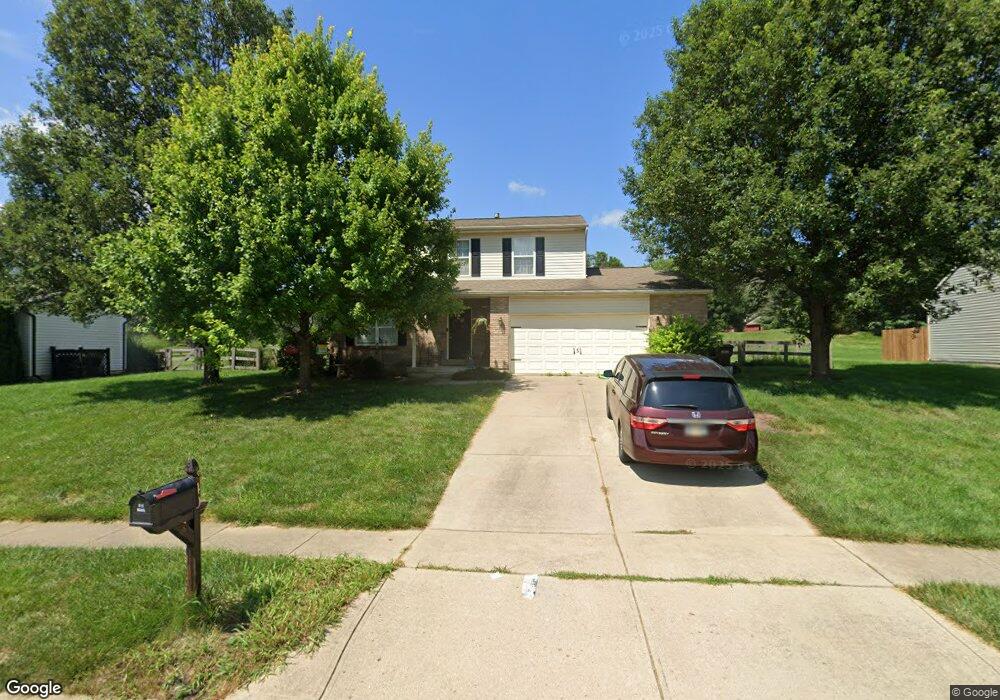
40 Andover Dr Springboro, OH 45066
Estimated Value: $339,806 - $373,000
3
Beds
3
Baths
1,565
Sq Ft
$229/Sq Ft
Est. Value
About This Home
This home is located at 40 Andover Dr, Springboro, OH 45066 and is currently estimated at $358,952, approximately $229 per square foot. 40 Andover Dr is a home located in Warren County with nearby schools including Clearcreek Elementary School, Springboro Intermediate School, and Dennis Elementary School.
Ownership History
Date
Name
Owned For
Owner Type
Purchase Details
Closed on
Sep 21, 2016
Sold by
Sibert Steven S and Sibert Tammy S
Bought by
Curry Krista M and Curry Adam D
Current Estimated Value
Purchase Details
Closed on
Nov 9, 1999
Sold by
Williamsburg Properties
Bought by
Siebert Steven S and Siebert Tammy S
Home Financials for this Owner
Home Financials are based on the most recent Mortgage that was taken out on this home.
Original Mortgage
$102,000
Interest Rate
7.78%
Mortgage Type
New Conventional
Purchase Details
Closed on
Oct 20, 1999
Sold by
Brookfield Dev Corp
Bought by
Williamsburg Properties Inc
Home Financials for this Owner
Home Financials are based on the most recent Mortgage that was taken out on this home.
Original Mortgage
$102,000
Interest Rate
7.78%
Mortgage Type
New Conventional
Create a Home Valuation Report for This Property
The Home Valuation Report is an in-depth analysis detailing your home's value as well as a comparison with similar homes in the area
Home Values in the Area
Average Home Value in this Area
Purchase History
| Date | Buyer | Sale Price | Title Company |
|---|---|---|---|
| Curry Krista M | -- | Landsel Title Agency | |
| Siebert Steven S | $151,600 | -- | |
| Williamsburg Properties Inc | $305,100 | -- |
Source: Public Records
Mortgage History
| Date | Status | Borrower | Loan Amount |
|---|---|---|---|
| Previous Owner | Siebert Steven S | $102,000 |
Source: Public Records
Tax History
| Year | Tax Paid | Tax Assessment Tax Assessment Total Assessment is a certain percentage of the fair market value that is determined by local assessors to be the total taxable value of land and additions on the property. | Land | Improvement |
|---|---|---|---|---|
| 2025 | $4,211 | $103,320 | $31,500 | $71,820 |
| 2024 | $4,211 | $103,320 | $31,500 | $71,820 |
| 2023 | $3,286 | $74,819 | $17,220 | $57,599 |
| 2022 | $3,286 | $74,820 | $17,220 | $57,600 |
| 2021 | $3,065 | $74,820 | $17,220 | $57,600 |
| 2020 | $2,854 | $60,830 | $14,000 | $46,830 |
| 2019 | $2,644 | $60,830 | $14,000 | $46,830 |
| 2018 | $2,507 | $60,830 | $14,000 | $46,830 |
| 2017 | $2,561 | $53,127 | $12,422 | $40,705 |
| 2016 | $2,660 | $53,127 | $12,422 | $40,705 |
| 2015 | $2,541 | $53,127 | $12,422 | $40,705 |
| 2014 | $2,438 | $48,300 | $11,290 | $37,010 |
| 2013 | $2,436 | $59,890 | $14,000 | $45,890 |
Source: Public Records
Map
Nearby Homes
- 240 Tilly View
- 765 Beckley Farm Way
- 7 W Long Meadow Dr
- 210 Dan Haven Bend
- 175 Farmridge Rd
- 50 Morris St
- 45 Morris St Unit 15
- 8 Glasgow St Unit 30
- 18 Glasgow St
- 65 Morris St Unit 17
- 45 Morris St
- 18 Glasgow St Unit 29
- 8 Glasgow St
- 30 Morris St
- 50 Morris St Unit 4
- 65 Morris St
- 240 Bailey Ln
- 330 East St
- 1045 W State Route 73
- 1045 Ohio 73
- 30 Andover Dr
- 50 Andover Dr
- 60 Andover Dr
- 20 Andover Dr
- 47 Andover Dr
- 31 Andover Dr
- 70 Andover Dr
- 55 Andover Dr
- 10 Andover Dr
- 15 Andover Dr
- 1616 W Lower Springboro Rd
- 140 W Waterbury Dr
- 65 Andover Dr
- 90 W Long Meadow Dr
- 80 Andover Dr
- 160 W Waterbury Dr
- 5 Andover Dr
- 95 W Long Meadow Dr
- 80 W Long Meadow Dr
- 5 Beckworth Way
Your Personal Tour Guide
Ask me questions while you tour the home.