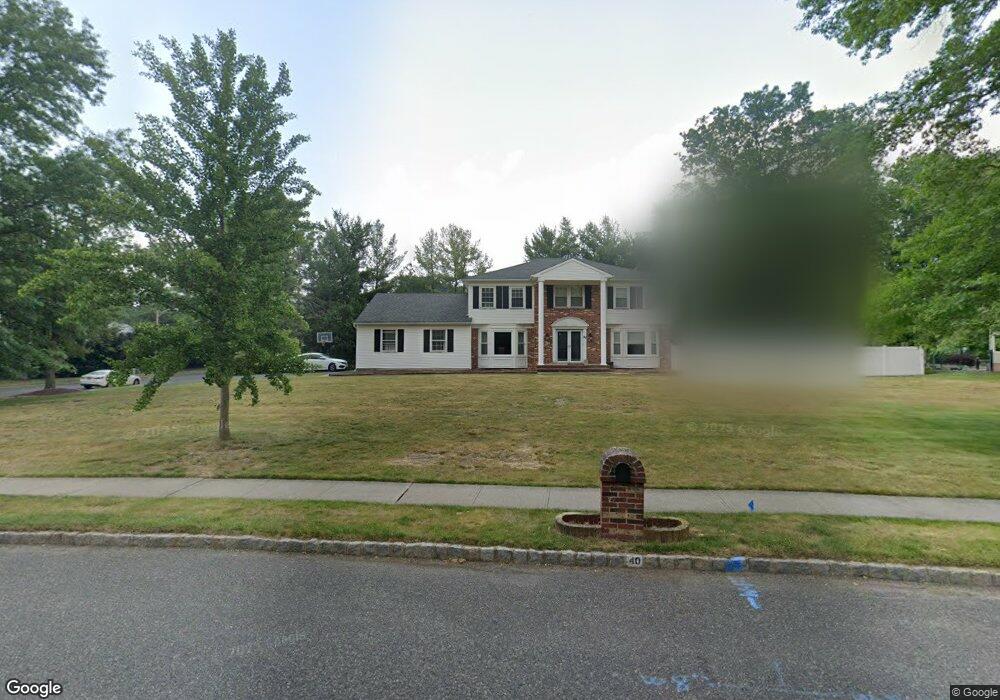
40 Apache Dr Manalapan, NJ 07726
Estimated Value: $1,035,000 - $1,088,000
4
Beds
2
Baths
3,089
Sq Ft
$343/Sq Ft
Est. Value
About This Home
This home is located at 40 Apache Dr, Manalapan, NJ 07726 and is currently estimated at $1,060,467, approximately $343 per square foot. 40 Apache Dr is a home located in Monmouth County with nearby schools including Clark Mills Elementary School, Pine Brook Elementary School, and Manalapan-Englishtown Middle School.
Ownership History
Date
Name
Owned For
Owner Type
Purchase Details
Closed on
Oct 7, 2002
Sold by
Przybylski Steven
Bought by
Cohen Douglas and Cohen Sheryn
Current Estimated Value
Home Financials for this Owner
Home Financials are based on the most recent Mortgage that was taken out on this home.
Original Mortgage
$407,000
Outstanding Balance
$167,657
Interest Rate
6.18%
Estimated Equity
$892,810
Create a Home Valuation Report for This Property
The Home Valuation Report is an in-depth analysis detailing your home's value as well as a comparison with similar homes in the area
Home Values in the Area
Average Home Value in this Area
Purchase History
| Date | Buyer | Sale Price | Title Company |
|---|---|---|---|
| Cohen Douglas | $527,000 | -- |
Source: Public Records
Mortgage History
| Date | Status | Borrower | Loan Amount |
|---|---|---|---|
| Open | Cohen Douglas | $407,000 |
Source: Public Records
Tax History
| Year | Tax Paid | Tax Assessment Tax Assessment Total Assessment is a certain percentage of the fair market value that is determined by local assessors to be the total taxable value of land and additions on the property. | Land | Improvement |
|---|---|---|---|---|
| 2025 | $15,663 | $966,000 | $422,800 | $543,200 |
| 2024 | $14,352 | $927,900 | $422,800 | $505,100 |
| 2023 | $14,352 | $862,500 | $372,800 | $489,700 |
| 2022 | $12,716 | $756,000 | $289,800 | $466,200 |
| 2021 | $12,716 | $612,500 | $197,800 | $414,700 |
| 2020 | $12,425 | $605,200 | $192,800 | $412,400 |
| 2019 | $12,829 | $624,300 | $222,800 | $401,500 |
| 2018 | $11,794 | $570,600 | $187,800 | $382,800 |
| 2017 | $11,359 | $549,800 | $177,800 | $372,000 |
| 2016 | $10,723 | $525,100 | $157,800 | $367,300 |
| 2015 | $10,436 | $505,600 | $147,800 | $357,800 |
| 2014 | $11,043 | $520,900 | $170,100 | $350,800 |
Source: Public Records
Map
Nearby Homes
- 183 Pine Brook Rd
- 7 Portsmouth Rd
- 210 Pine Brook Rd
- 96 Sofia Dr
- 12 Tori Ln
- 6 Scarlett Terrace
- 47 Sofia Dr
- 25 Tarrytown Rd
- 8 Chesapeake Rd
- 7 Friar Ln
- 16 Wiltshire Dr
- 7 Tarrytown Rd
- 70 Overlook Way Unit E
- 7 Whitehall Way
- 9 Winners Cir
- 4 Roxbury Ln
- 75 Overlook Way Unit K
- 115 Pension Rd
- 7 Richard Ct
- 92 Arrowood Rd Unit E
Your Personal Tour Guide
Ask me questions while you tour the home.