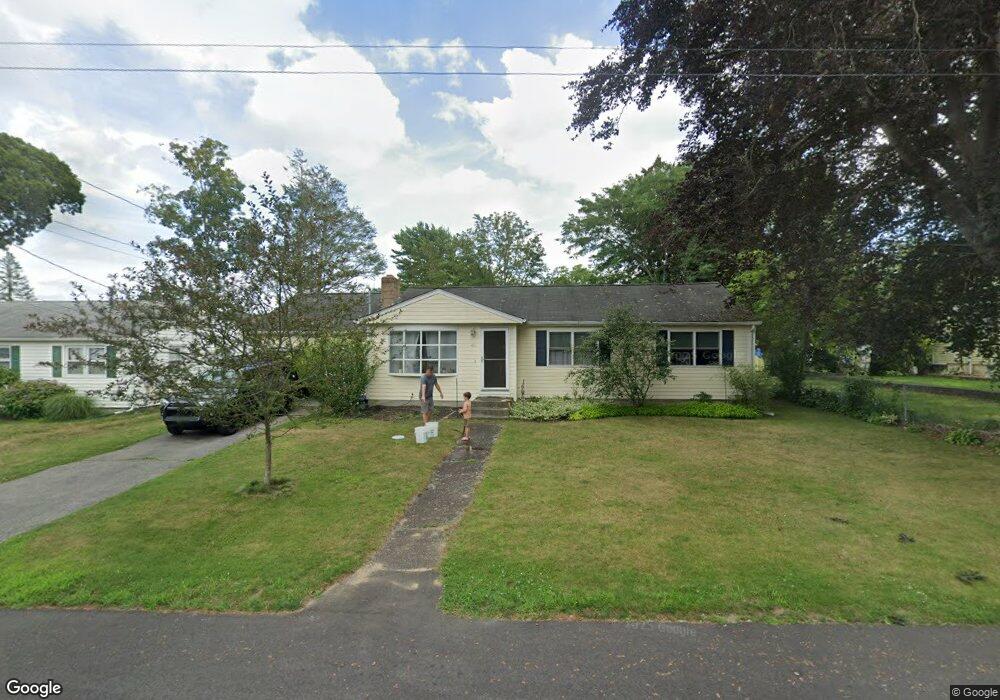
40 Bassett Ave Warwick, RI 02889
Long Meadow NeighborhoodEstimated Value: $386,040 - $437,000
3
Beds
1
Bath
1,208
Sq Ft
$341/Sq Ft
Est. Value
About This Home
This home is located at 40 Bassett Ave, Warwick, RI 02889 and is currently estimated at $412,010, approximately $341 per square foot. 40 Bassett Ave is a home located in Kent County with nearby schools including Saint Kevin School and Bishop Hendricken High School.
Ownership History
Date
Name
Owned For
Owner Type
Purchase Details
Closed on
Jan 21, 2025
Sold by
Pegram Dianna and Pegram Ryan
Bought by
Pegram Dianna
Current Estimated Value
Purchase Details
Closed on
Sep 30, 2016
Sold by
Hyslop Daniel B and Hyslop Elizabeth V
Bought by
Pegram Dianna and Pegram Ryan
Home Financials for this Owner
Home Financials are based on the most recent Mortgage that was taken out on this home.
Original Mortgage
$206,150
Interest Rate
3.43%
Mortgage Type
New Conventional
Purchase Details
Closed on
Apr 27, 2007
Sold by
Oakley Robert J and Oakley Ann F
Bought by
Hyslop Daniel B and Hyslop Elizabeth V
Home Financials for this Owner
Home Financials are based on the most recent Mortgage that was taken out on this home.
Original Mortgage
$176,800
Interest Rate
6.18%
Mortgage Type
Purchase Money Mortgage
Create a Home Valuation Report for This Property
The Home Valuation Report is an in-depth analysis detailing your home's value as well as a comparison with similar homes in the area
Home Values in the Area
Average Home Value in this Area
Purchase History
| Date | Buyer | Sale Price | Title Company |
|---|---|---|---|
| Pegram Dianna | -- | None Available | |
| Pegram Dianna | $217,000 | -- | |
| Pegram Dianna | $217,000 | -- | |
| Hyslop Daniel B | $221,000 | -- | |
| Hyslop Daniel B | $221,000 | -- |
Source: Public Records
Mortgage History
| Date | Status | Borrower | Loan Amount |
|---|---|---|---|
| Previous Owner | Pegram Dianna | $206,150 | |
| Previous Owner | Hyslop Daniel B | $167,250 | |
| Previous Owner | Hyslop Daniel B | $176,800 | |
| Previous Owner | Hyslop Daniel B | $19,676 |
Source: Public Records
Tax History Compared to Growth
Tax History
| Year | Tax Paid | Tax Assessment Tax Assessment Total Assessment is a certain percentage of the fair market value that is determined by local assessors to be the total taxable value of land and additions on the property. | Land | Improvement |
|---|---|---|---|---|
| 2025 | $4,663 | $367,200 | $111,100 | $256,100 |
| 2024 | $4,266 | $294,800 | $91,800 | $203,000 |
| 2023 | $4,183 | $294,800 | $91,800 | $203,000 |
| 2022 | $3,873 | $206,800 | $54,200 | $152,600 |
| 2021 | $3,873 | $206,800 | $54,200 | $152,600 |
| 2020 | $3,873 | $206,800 | $54,200 | $152,600 |
| 2019 | $3,873 | $206,800 | $54,200 | $152,600 |
| 2018 | $3,324 | $159,800 | $54,200 | $105,600 |
| 2017 | $3,234 | $159,800 | $54,200 | $105,600 |
| 2016 | $3,234 | $159,800 | $54,200 | $105,600 |
| 2015 | $3,142 | $151,400 | $56,000 | $95,400 |
| 2014 | $3,037 | $151,400 | $56,000 | $95,400 |
| 2013 | $2,996 | $151,400 | $56,000 | $95,400 |
Source: Public Records
Map
Nearby Homes
- 41 Lyndon Ave
- 59 Recess Ln
- 60 Recess Ln
- 276 Tidewater Dr
- 123 Payton Ave
- 14 Beatrice Ave
- 19 Beatrice Ave
- 225 Tidewater Dr
- 106 Park Ave
- 57 Ocean Ave
- 150 Mill Cove Rd
- 185 Tidewater Dr
- 38 Pender Ave
- 00 Grove Ave
- 25 Webb Ave
- 539 Tidewater Dr
- 0 Avon Ave
- 0 Samuel Gorton Ave
- 28 Lighthouse Ln
- 81 Fairhaven Ave